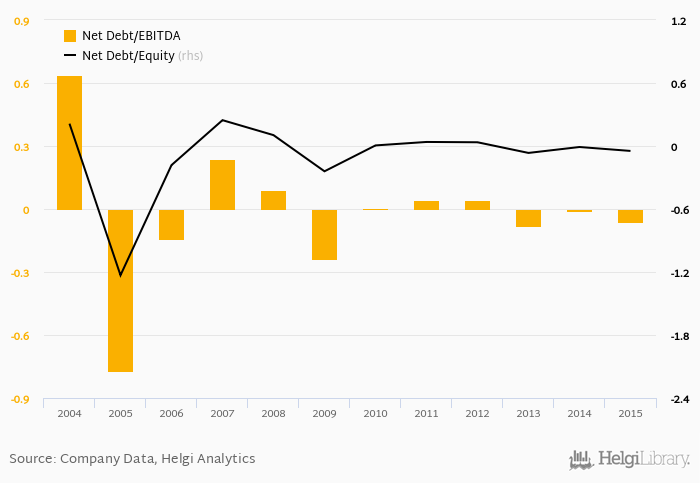
Lego Group's net debt stood at DKK -835 mil and accounted for -0.047 of equity at the end of 2015. The ratio is down 0.037 pp compared to the previous year.
Historically, the firm’s net debt to equity reached a high of 0.246 in 2007 and a low of -1.23 in 2005 between 2004 and 2015. The average for the last five years was -0.010%.
Net debt to EBITDA was calculated at -0.063x at the end of the year. That is down from 0.005x seen in 2010. The ratio reached a high of 0.638x in 2004 and a low of -0.773x in 2005.
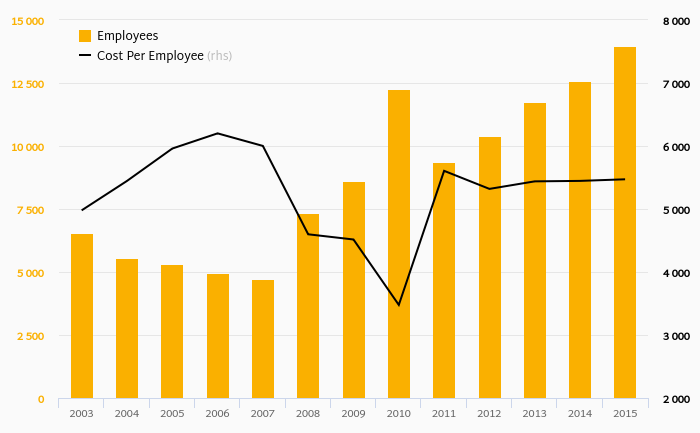
The company’s cost of funding amounted to 26.2% in 2015, down which is above the 5-year of 34.8%. Funding costs have “eaten” some 0.784% of the operating profit generated in 2019.
You can see all the company’s data at Lego Group profile, or you can download a report on the company in the report section.
 Helgi Library