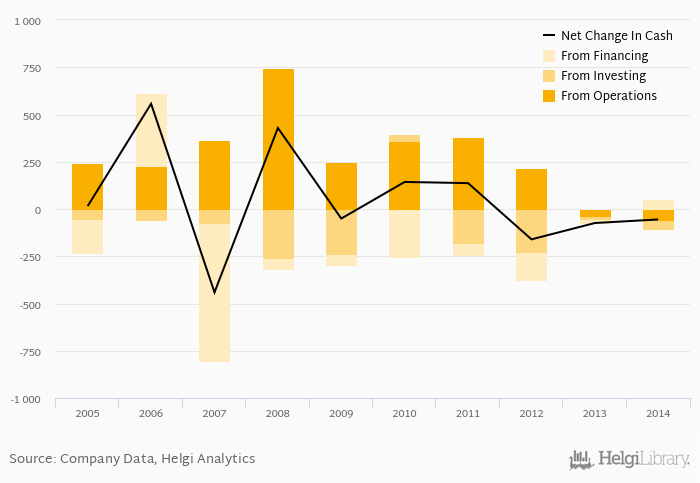
New World Resources's operating cash flow stood at EUR -56.3 mil in 2014, down 56.8% when compared to the previous year. Historically, between 2005 - 2014, the firm’s operating cash flow reached a high of EUR 746 mil in 2008 and a low of EUR -56.3 mil in 2014.
New World Resources's total investments stood at EUR -51.3 mil and accounted for 8.82% of sales in 2014. This is compared to an average of 13.4% as seen over the last five years.
Cash from financing amounted to EUR 52.2 mil, so the company generated EUR -55.4 mil net cash in 2014.
At the end of 2014, the company had a net debt of EUR 281 mil, or -1.63x of EBITDA and -1.76 of equity. Net working capital amounted to EUR -25.9 mil, or -3.83% of sales. The cash conversion cycle stood at -125 days in 2014. This is a deterioration compared to the previous year (-120 days), so New World Resources’s working capital was tied up for 5.41 more days.
You can see all the company’s data at New World Resources profile, or you can download a report on the company in the report section.
 Helgi Library