
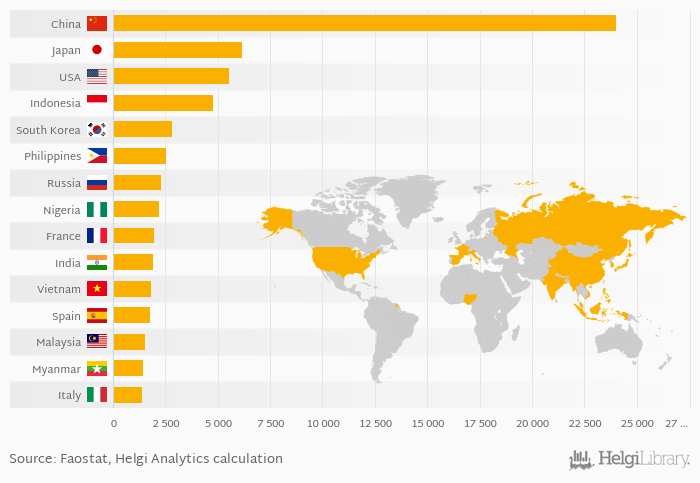
Based on a comparison of 157 countries in 2013, China ranked the highest in marine fish consumption with 24,002 kt followed by Japan and USA. On the other end of the scale was Ethiopia with -0.937 kt, Mongolia with 0.770 kt and Lesotho with 0.867 kt.
Total marine fish consumption reached 86,255 kt in 2013 in the World according to Faostat. This is 0.95 % more than in the previous year and 13.0 % more than 10 years ago.
Historically, total marine fish consumption reached an all time high of 86,255 kt in 2013 and an all time low of 23,121 kt in 1961. The average annual growth amounted to 2.56 % since 1961.
The top ranked country, China, accounted for 27.8 % of marine fish consumption in the world. The top 3 countries hold a 41.3 % share while the ten largest countries some 62.8 % in 2013.
Data for more countries are available at Marine Fish Consumption (Total) indicator page.
| Marine Fish Consumption (Total) | Unit | 1993 | 1994 | 1995 | 1996 | 1997 | 1998 | 1999 | 2000 | 2001 | 2002 | 2003 | 2004 | 2005 | 2006 | 2007 | 2008 | 2009 | 2010 | 2011 | 2012 | 2013 |
| China | kt | 21,349 | 22,155 | 23,241 | 23,525 | 24,056 | ||||||||||||||||
| France | kt | 1,829 | 1,877 | 1,887 | 1,922 | 1,918 | ||||||||||||||||
| India | kt | 2,318 | 2,584 | 2,261 | 1,808 | 1,708 | ||||||||||||||||
| Indonesia | kt | 4,250 | 4,380 | 4,417 | 4,597 | 4,797 | ||||||||||||||||
| Italy | kt | 1,356 | 1,305 | 1,325 | 1,374 | 1,377 | ||||||||||||||||
| Japan | kt | 6,401 | 6,455 | 6,177 | 6,177 | 6,170 | ||||||||||||||||
| Malaysia | kt | 1,456 | 1,458 | 1,478 | 1,479 | 1,476 | ||||||||||||||||
| Myanmar | kt | 1,036 | 1,192 | 1,300 | 1,366 | 1,521 | ||||||||||||||||
| Nigeria | kt | 2,193 | 2,011 | 1,771 | 1,932 | 2,280 | ||||||||||||||||
| Philippines | kt | 2,462 | 2,458 | 2,600 | 2,514 | 2,336 | ||||||||||||||||
| Russia | kt | 2,456 | 2,198 | 2,242 | 2,398 | 2,264 | ||||||||||||||||
| South Korea | kt | 2,674 | 2,652 | 2,779 | 2,776 | 2,775 | ||||||||||||||||
| Spain | kt | 1,760 | 1,688 | 1,684 | 1,732 | 1,728 | ||||||||||||||||
| USA | kt | 5,468 | 5,336 | 5,292 | 5,402 | 5,443 | ||||||||||||||||
| Vietnam | kt | 1,437 | 1,590 | 1,764 | 1,728 | 1,795 |
 Helgi Library


