
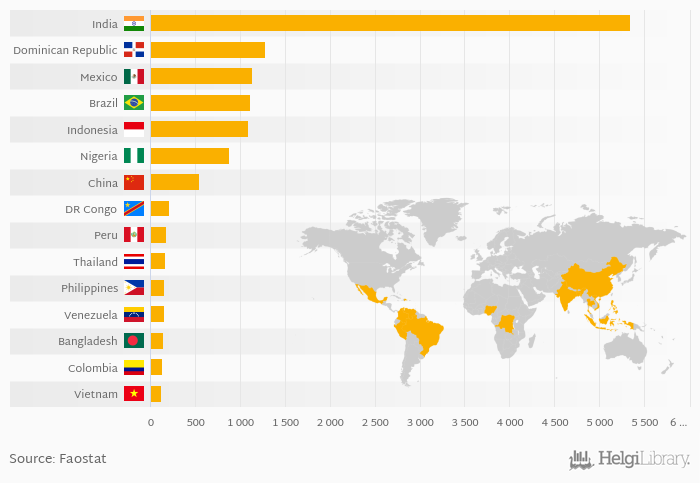
Based on a comparison of 63 countries in 2022, India ranked the highest in papaya production with 5,341 kt followed by Dominican Republic and Mexico. On the other end of the scale was Zimbabwe with 0.044 kt, Cameroon with 0.048 kt and Maldives with 0.071 kt.
Total papaya production reached 13,822 kt in 2022 in the World according to Faostat. This is 1.91 % less than in the previous year and 10.3 % more than 10 years ago.
Historically, total papaya production reached an all time high of 14,234 kt in 2019 and an all time low of 1,323 kt in 1961. The average annual growth amounted to 3.92 % since 1961.
The top ranked country, India, accounted for 38.6 % of papaya production in the world. The top 3 countries hold a 56.2 % share while the ten largest countries some 86.4 % in 2022.
Data for more countries are available at Papaya Production indicator page.
| Papaya Production | Unit | 2002 | 2003 | 2004 | 2005 | 2006 | 2007 | 2008 | 2009 | 2010 | 2011 | 2012 | 2013 | 2014 | 2015 | 2016 | 2017 | 2018 | 2019 | 2020 | 2021 | 2022 |
| Bangladesh | kt | 130 | 135 | 132 | 136 | 131 | ||||||||||||||||
| Brazil | kt | 1,297 | 1,058 | 1,065 | 1,171 | 1,235 | ||||||||||||||||
| China | kt | 419 | 441 | 468 | 497 | 522 | ||||||||||||||||
| Colombia | kt | 177 | 169 | 125 | 145 | 196 | ||||||||||||||||
| Dem. Republic of the Congo | kt | 213 | 212 | 210 | 209 | 210 | ||||||||||||||||
| Dominican Republic | kt | 863 | 869 | 1,027 | 1,176 | 1,094 | ||||||||||||||||
| India | kt | 5,667 | 5,940 | 5,989 | 6,050 | 5,780 | ||||||||||||||||
| Indonesia | kt | 904 | 875 | 888 | 987 | 1,016 | ||||||||||||||||
| Mexico | kt | 952 | 962 | 1,040 | 1,083 | 1,117 | ||||||||||||||||
| Nigeria | kt | 843 | 838 | 836 | 878 | 887 | ||||||||||||||||
| Peru | kt | 169 | 177 | 176 | 166 | 188 | ||||||||||||||||
| Philippines | kt | 162 | 167 | 169 | 166 | 163 | ||||||||||||||||
| Thailand | kt | 166 | 165 | 166 | 166 | 166 | ||||||||||||||||
| Venezuela | kt | 177 | 161 | 154 | 101 | 157 | ||||||||||||||||
| Vietnam | kt | 78.4 | 85.6 | 92.9 | 109 | 115 |
 Helgi Library


