
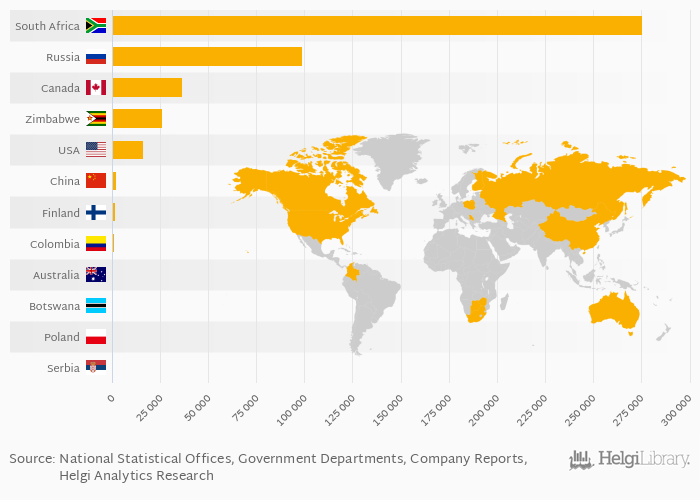
Based on a comparison of 12 countries in 2015, South Africa ranked the highest in platinum group metals (mine) production with 275,515 kg followed by Russia and Canada. On the other end of the scale was Serbia with 23.0 kg, Poland with 145 kg and Botswana with 187 kg.
Data for more countries are available at Platinum Group Metals (Mine) Production indicator page.
| Platinum Group Metals (Mine) Production | Unit | 1995 | 1996 | 1997 | 1998 | 1999 | 2000 | 2001 | 2002 | 2003 | 2004 | 2005 | 2006 | 2007 | 2008 | 2009 | 2010 | 2011 | 2012 | 2013 | 2014 | 2015 |
| Australia | kg | 1,034 | 781 | 445 | 706 | 786 | ||||||||||||||||
| Botswana | kg | ... | ... | ... | ... | ... | ... | 5,474 | 3,328 | 2,488 | 3,017 | 1,555 | ||||||||||
| Canada | kg | 11,400 | 10,000 | 23,600 | 23,500 | 29,500 | ||||||||||||||||
| China | kg | ... | ... | ... | ... | ... | 2,100 | 2,100 | 2,100 | 2,100 | 2,100 | |||||||||||
| Colombia | kg | 929 | 997 | 1,231 | 1,460 | 1,504 | ||||||||||||||||
| Finland | kg | ... | ... | ... | ... | ... | ... | ... | ... | ... | ... | ... | ... | ... | ... | ... | ... | ... | 808 | 1,712 | ||
| Poland | kg | ... | ... | ... | ... | ... | ... | ... | ... | ... | ... | 50.0 | 50.0 | 36.0 | 62.0 | 81.0 | ||||||
| Russia | kg | 139,700 | 144,400 | 136,100 | 117,600 | 111,600 | ||||||||||||||||
| Serbia | kg | ... | ... | ... | ... | ... | ... | ... | 50.0 | 22.0 | 10.0 | 25.0 | 23.0 | |||||||||
| South Africa | kg | 271,393 | 287,304 | 288,850 | 254,338 | 264,188 | ||||||||||||||||
| USA | kg | 16,485 | 15,050 | 16,100 | 15,970 | 16,320 | ||||||||||||||||
| Zimbabwe | kg | 13,393 | 17,091 | 21,411 | 23,138 | 25,896 |
 Helgi Library


