
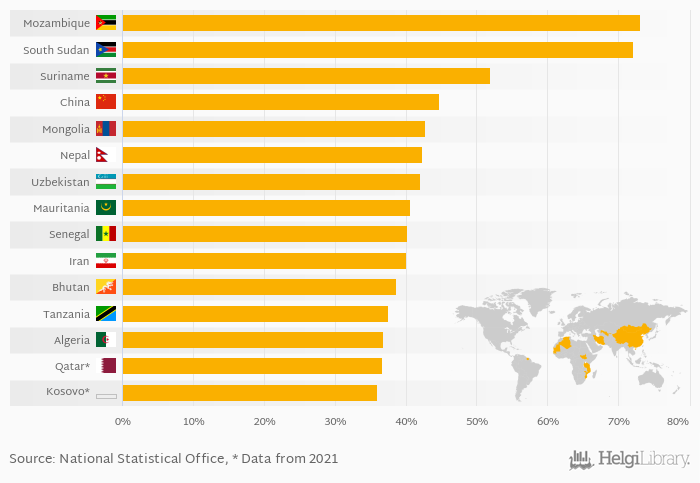
Based on a comparison of 169 countries in 2022, Mozambique ranked the highest in gross capital formation as a share of GDP with 73.1% followed by South Sudan and Suriname. On the other end of the scale was Liberia with 0%, Guyana with 3.05% and Lebanon with 5.59%.
Average gross capital formation as a share of GDP reached 26.3% in 2022 in the World according to the National Statistical Office. This is 0.151 % more than in the previous year and 2.26 % more than 10 years ago.
Historically, average gross capital formation as a share of GDP reached an all time high of 29.0% in 1974 and an all time low of 0.225% in 1967. The average annual growth amounted to 8.32 % since 1960.
Data for more countries are available at Gross Capital Formation (As % of GDP) indicator page.
| Gross Capital Formation (As % of GDP) | Unit | 2003 | 2004 | 2005 | 2006 | 2007 | 2008 | 2009 | 2010 | 2011 | 2012 | 2013 | 2014 | 2015 | 2016 | 2017 | 2018 | 2019 | 2020 | 2021 | 2022 | 2023 |
| Algeria | % | 48.5% | 47.3% | 44.7% | 41.9% | 37.3% | ||||||||||||||||
| Bhutan | % | 54.6% | 49.8% | 42.6% | 35.5% | 34.5% | ||||||||||||||||
| China | % | 43.2% | 44.0% | 43.1% | 42.9% | 42.6% | ||||||||||||||||
| Iran | % | 34.3% | 32.6% | 39.4% | 44.3% | 41.3% | ||||||||||||||||
| Kosovo | % | 34.7% | 36.3% | 34.6% | 33.4% | 36.0% | ... | ... | ||||||||||||||
| Mauritania | % | 37.9% | 46.5% | 46.9% | 46.8% | 57.2% | ||||||||||||||||
| Mongolia | % | 27.4% | 39.4% | 35.6% | 22.4% | 36.7% | ||||||||||||||||
| Mozambique | % | 33.2% | 50.0% | 60.1% | 50.8% | 49.8% | ||||||||||||||||
| Nepal | % | 37.3% | 39.5% | 41.4% | 30.4% | 35.8% | ||||||||||||||||
| Qatar | % | 42.6% | 40.7% | 42.6% | 43.8% | 36.7% | ... | ... | ||||||||||||||
| Senegal | % | 29.8% | 32.6% | 32.0% | 35.2% | 37.9% | ||||||||||||||||
| South Sudan | % | ... | ... | ... | ... | ... | 7.56% | 8.45% | 16.0% | 31.4% | 59.1% | |||||||||||
| Suriname | % | 46.6% | 50.5% | 50.9% | 51.1% | 52.1% | ||||||||||||||||
| Tanzania | % | 34.0% | 38.4% | 39.7% | 39.9% | 35.7% | ||||||||||||||||
| Uzbekistan | % | 29.5% | 42.4% | 40.5% | 38.7% | 40.6% |
 Helgi Library


