
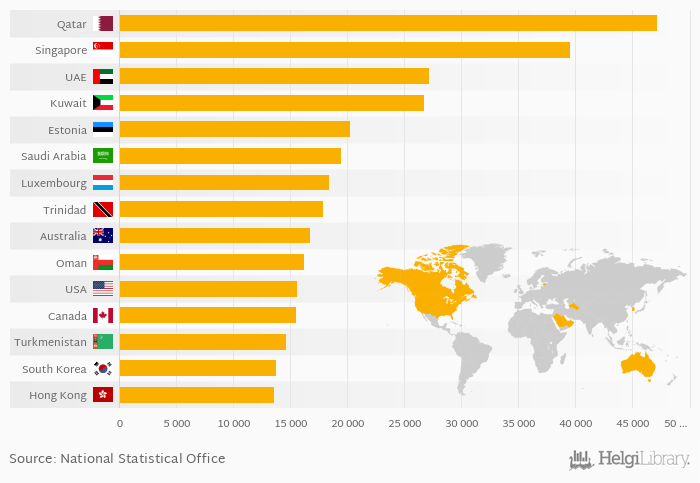
Based on a comparison of 79 countries in 2017, Qatar ranked the highest in CO2 emissions per capita with 47,170 kg followed by Singapore and United Arab Emirates. On the other end of the scale was Bangladesh with 513 kg, Pakistan with 988 kg and Sri Lanka with 989 kg.
Average CO2 emissions per capita reached 4,534 kg in 2017 in the World according to World Bank / EIA. This is 0.482 % more than in the previous year and 0.579 % more than 10 years ago.
Historically, average CO2 emissions per capita reached an all time high of 4,602 kg in 2013 and an all time low of 3,060 kg in 1961. The average annual growth amounted to 0.666 % since 1960.
Data for more countries are available at CO2 Emissions Per Capita indicator page.
| CO2 Emissions Per Capita | Unit | 1997 | 1998 | 1999 | 2000 | 2001 | 2002 | 2003 | 2004 | 2005 | 2006 | 2007 | 2008 | 2009 | 2010 | 2011 | 2012 | 2013 | 2014 | 2015 | 2016 | 2017 |
| Australia | kg | 17,762 | 17,229 | 16,876 | 17,010 | 17,162 | ||||||||||||||||
| Canada | kg | 15,445 | 14,779 | 15,100 | 15,236 | 14,895 | ||||||||||||||||
| Estonia | kg | 18,116 | 17,862 | 19,982 | 19,078 | 17,833 | ||||||||||||||||
| Hong Kong | kg | 12,991 | 12,456 | 12,782 | 12,467 | 12,516 | ||||||||||||||||
| Kuwait | kg | 27,522 | 29,612 | 29,983 | 25,950 | 27,530 | ||||||||||||||||
| Luxembourg | kg | 22,460 | 21,564 | 20,279 | 19,228 | 18,380 | ||||||||||||||||
| Oman | kg | 17,305 | 17,425 | 18,148 | 16,699 | 16,713 | ||||||||||||||||
| Qatar | kg | 42,133 | 46,002 | 38,214 | 40,579 | 44,484 | ||||||||||||||||
| Saudi Arabia | kg | 18,085 | 18,624 | 18,614 | 19,548 | 19,807 | ||||||||||||||||
| Singapore | kg | 37,160 | 36,296 | 35,790 | 35,147 | 36,718 | ||||||||||||||||
| South Korea | kg | 13,262 | 13,179 | 13,183 | 13,102 | 13,295 | ||||||||||||||||
| Trinidad and Tobago | kg | 20,056 | 19,551 | 20,541 | 20,054 | 19,748 | ||||||||||||||||
| Turkmenistan | kg | 13,290 | 14,431 | 12,960 | 14,081 | 15,497 | ||||||||||||||||
| USA | kg | 17,084 | 16,317 | 16,656 | 16,717 | 16,170 | ||||||||||||||||
| United Arab Emirates | kg | 24,908 | 25,399 | 26,657 | 26,104 | 27,953 |
 Helgi Library


