
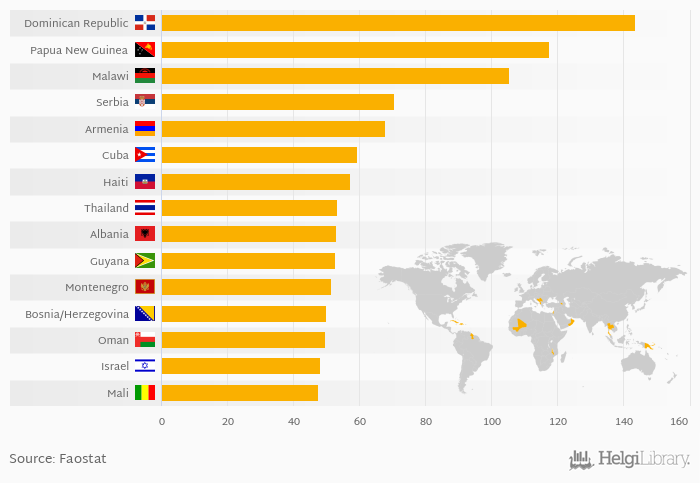
Based on a comparison of 155 countries in 2018, Dominican Republic ranked the highest in fruit consumption per capita with 144 kg followed by Papua New Guinea and Malawi. On the other end of the scale was Liberia with 0.623 kg, Uganda with 1.08 kg and Zimbabwe with 1.45 kg.
Average fruit consumption per capita reached 26.1 kg in 2018 in the World according to Faostat. This is 1.75 % more than in the previous year and 9.24 % more than 10 years ago.
Historically, average fruit consumption per capita reached an all time high of 26.5 kg in 2013 and an all time low of 12.8 kg in 1975. The average annual growth amounted to 1.11 % since 1961.
Data for more countries are available at Fruit Consumption Per Capita indicator page.
| Fruit Consumption Per Capita | Unit | 2001 | 2002 | 2003 | 2004 | 2005 | 2006 | 2007 | 2008 | 2009 | 2010 | 2011 | 2012 | 2013 | 2014 | 2015 | 2016 | 2017 | 2018 | 2019 | 2020 | 2021 |
| Albania | kg | 48.9 | 57.4 | 53.2 | 53.0 | 53.6 | ||||||||||||||||
| Armenia | kg | 63.2 | 57.9 | 66.3 | 60.3 | 61.0 | ||||||||||||||||
| Bosnia and Herzegovina | kg | 39.4 | 44.0 | 29.1 | 49.4 | 37.8 | ||||||||||||||||
| Cuba | kg | 62.9 | 62.7 | 61.4 | 59.9 | 61.0 | ||||||||||||||||
| Dominican Republic | kg | 139 | 147 | 152 | 174 | 180 | ||||||||||||||||
| Guyana | kg | 90.1 | 72.5 | 104 | 98.0 | 108 | ||||||||||||||||
| Haiti | kg | 62.7 | 60.9 | 58.4 | 56.9 | 42.9 | ||||||||||||||||
| Israel | kg | 47.9 | 52.8 | 53.1 | 49.2 | 54.6 | ||||||||||||||||
| Malawi | kg | 91.7 | 88.2 | 88.9 | 105 | 92.3 | ||||||||||||||||
| Mali | kg | 32.4 | 43.2 | 40.6 | 46.2 | 44.7 | ||||||||||||||||
| Montenegro | kg | ... | ... | ... | ... | ... | 41.8 | 49.8 | 51.4 | 51.4 | 54.7 | |||||||||||
| Oman | kg | 48.9 | 57.3 | 56.1 | 48.2 | 54.1 | ||||||||||||||||
| Papua New Guinea | kg | ... | ... | ... | ... | ... | ... | ... | ... | ... | ... | ... | ... | ... | 113 | 111 | 110 | 109 | 103 | |||
| Serbia | kg | ... | ... | ... | ... | ... | 65.4 | 78.1 | 63.2 | 71.9 | 73.1 | |||||||||||
| Thailand | kg | 49.4 | 50.9 | 46.3 | 34.6 | 32.9 |
 Helgi Library


