
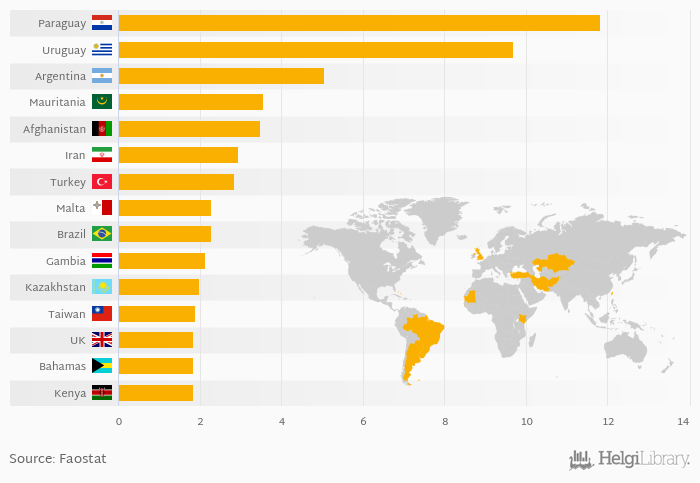
Based on a comparison of 155 countries in 2013, Paraguay ranked the highest in tea consumption per capita with 11.8 kg followed by Uruguay and Argentina. On the other end of the scale was Serbia with 0.010 kg, Uganda with 0.010 kg and Togo with 0.010 kg.
Average tea consumption per capita reached 0.850 kg in 2013 in the World according to Faostat. This is 2.35 % more than in the previous year and 25.9 % more than 10 years ago.
Historically, average tea consumption per capita reached an all time high of 0.850 kg in 2013 and an all time low of 0.390 kg in 1962. The average annual growth amounted to 1.46 % since 1961.
Data for more countries are available at Tea Consumption Per Capita indicator page.
| Tea Consumption Per Capita | Unit | 1993 | 1994 | 1995 | 1996 | 1997 | 1998 | 1999 | 2000 | 2001 | 2002 | 2003 | 2004 | 2005 | 2006 | 2007 | 2008 | 2009 | 2010 | 2011 | 2012 | 2013 |
| Afghanistan | kg | 1.06 | 1.46 | 0.350 | 1.09 | 2.17 | ||||||||||||||||
| Argentina | kg | 6.50 | 5.14 | 4.82 | 5.42 | 5.29 | ||||||||||||||||
| Bahamas | kg | 1.20 | 1.20 | 1.31 | 0.960 | 0.380 | ||||||||||||||||
| Brazil | kg | 2.06 | 2.03 | 2.05 | 1.96 | 1.99 | ||||||||||||||||
| Gambia | kg | 2.09 | 2.03 | 1.18 | 3.38 | 3.22 | ||||||||||||||||
| Iran | kg | 0.260 | 2.67 | 2.81 | 2.69 | 1.83 | ||||||||||||||||
| Kazakhstan | kg | 1.78 | 1.98 | 1.68 | 1.77 | 1.81 | ||||||||||||||||
| Kenya | kg | 0.100 | 0.100 | 0.050 | 0.050 | 3.24 | ||||||||||||||||
| Malta | kg | 1.28 | 1.08 | 1.62 | 2.04 | 2.24 | ||||||||||||||||
| Mauritania | kg | 2.91 | 2.33 | 2.75 | 2.20 | 2.63 | ||||||||||||||||
| Paraguay | kg | 13.1 | 11.3 | 11.0 | 12.1 | 12.2 | ||||||||||||||||
| Taiwan | kg | 1.64 | 0.830 | 1.73 | 1.95 | 1.85 | ||||||||||||||||
| Turkey | kg | 2.97 | 2.83 | 2.84 | 3.35 | 3.11 | ||||||||||||||||
| United Kingdom | kg | 2.26 | 2.22 | 1.93 | 1.94 | 2.06 | ||||||||||||||||
| Uruguay | kg | 8.60 | 9.45 | 9.26 | 9.26 | 9.55 |
 Helgi Library


