Sales of new cars decreased by 85.8 thousand in October compared to last year
In the first ten months of the year, the decline reached 27.2% yoy
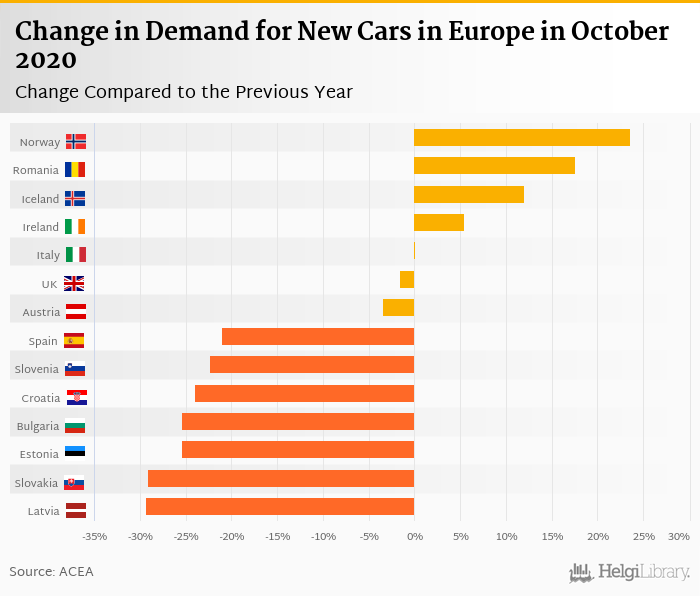
Norway performed relatively the best (up 23.6% yoy) while sales in Latvia showed the weakest change compared to the last year (down 29.3% yoy)
Sales of new passenger cars reached 1,129 thousand in October 2020 in the enlarged Europe (EU plus Iceland, Norway and Switzerland), according to ACEA. This is 7.06%, or 85.8 thousand less than in the previous year. In the first ten months of 2020, some 9,698 thousand cars were sold in Europe, down 27.2% yoy.
In October, the EU market slipped back into negative territory, after posting the first increase of the year in September. Registrations of new cars declined by 7.8% to 953,615 units last month, as several European governments reimposed restrictions to battle a second wave of the coronavirus. With the exception of Ireland and Romania, losses were posted in all EU markets, including the four major ones.
Historically, between 1990 and 2020, sales of passenger cars in Europe reached a high of 1,937 thousand in March 2017 and a low of 292 thousand in April 2020.


In October, most vehicles (274 thousand) were sold in Germany (down 3.62% yoy), followed by France (171 thousand, down 9.49%), Italy with 157 thousand cars (up 0.081%), 141 thousand new vehicles were registered in the United Kingdom (down 1.61%) and 74.2 thousand in Spain (down 21.0%). The five largest countries accounted for 65.8% of total new vehicles registered in October 2020.
In absolute terms, the best performance in sales of new cars has been seen in Norway (up 2.47 thousand cars) and Romania (up 1.87 thousand cars). At the other end of the scale, Spain and France showed the biggest drop in registration of new cars in October when compared to last year (down 19.7 thousand and down 17.9 thousand cars, respectively).
In relative terms, sales in Norway (+23.6%) and Romania (+17.6%) performed the best compared to a year ago, whereas registration in Latvia and Slovakia the worst (-29.3% and -29.1% yoy), in October 2020, according to ACEA:

In the first ten months of the year, some 9,698 thousand cars were sold in Europe, down 27.2% yoy. The table below shows details of the sales for each of the European country:
| Country | October 2020 | October 2019 | YOY Change % | 1-10/2020 | 1-10/2019 | YOY Change % |
|---|---|---|---|---|---|---|
| Austria | 24.3 | 25.1 | -3.44 | 205 | 283 | -27.7 |
| Belgium | 38.7 | 42.7 | -9.39 | 372 | 482 | -22.8 |
| Bulgaria | 2.09 | 2.80 | -25.4 | 19.1 | 29.7 | -35.6 |
| Croatia | 3.10 | 4.08 | -24.0 | 31.4 | 55.5 | -43.5 |
| Cyprus | 0.774 | 0.959 | -19.3 | 8.38 | 10.5 | -19.9 |
| Czech Republic | 16.8 | 19.9 | -15.6 | 165 | 211 | -21.7 |
| Denmark | 15.1 | 18.4 | -17.9 | 157 | 192 | -18.1 |
| Estonia | 1.54 | 2.06 | -25.4 | 15.8 | 22.7 | -30.4 |
| Finland | 7.50 | 9.37 | -19.9 | 80.9 | 97.3 | -16.8 |
| France | 171 | 189 | -9.49 | 1,338 | 1,830 | -26.9 |
| Germany | 274 | 285 | -3.62 | 2,316 | 3,025 | -23.4 |
| Greece | 6.78 | 7.28 | -6.87 | 66.8 | 100 | -33.2 |
| Hungary | 11.9 | 12.5 | -4.06 | 102 | 128 | -20.0 |
| Iceland | 0.740 | 0.661 | 12.0 | 8.01 | 10.5 | -23.7 |
| Ireland | 2.30 | 2.18 | 5.37 | 88.4 | 116 | -24.0 |
| Italy | 157 | 157 | 0.081 | 1,122 | 1,621 | -30.8 |
| Latvia | 1.11 | 1.57 | -29.3 | 11.5 | 15.7 | -26.5 |
| Lithuania | 3.42 | 4.10 | -16.6 | 31.7 | 38.8 | -18.4 |
| Luxembourg | 3.98 | 4.89 | -18.6 | 38.0 | 47.9 | -20.7 |
| Netherlands | 32.0 | 34.1 | -6.20 | 282 | 369 | -23.6 |
| Norway | 12.9 | 10.5 | 23.6 | 108 | 121 | -10.6 |
| Poland | 40.1 | 46.9 | -14.6 | 335 | 458 | -26.8 |
| Portugal | 13.7 | 15.6 | -12.6 | 119 | 190 | -37.1 |
| Romania | 12.5 | 10.6 | 17.6 | 97.1 | 135 | -27.9 |
| Slovakia | 6.69 | 9.44 | -29.1 | 62.3 | 78.8 | -20.9 |
| Slovenia | 4.55 | 5.86 | -22.3 | 47.6 | 61.6 | -22.7 |
| Spain | 74.2 | 94.0 | -21.0 | 670 | 1,059 | -36.8 |
| Sweden | 28.1 | 29.6 | -5.01 | 231 | 277 | -16.8 |
| Switzerland | 21.0 | 26.1 | -19.6 | 185 | 252 | -26.9 |
| United Kingdom | 141 | 143 | -1.61 | 1,385 | 2,006 | -31.0 |
| EU + EFTA | 1,129 | 1,215 | -7.06 | 9,698 | 13,331 | -27.2 |
Volkswagen Group sold the most cars in October 2020 in Europe, some 283 thousand vehicles representing 25.1% of the European market. Sales of PSA Group amounted to 172 thousand vehicles (or 15.2% of the market) while Renault Group and Hyundai Group held 10.5% and 7.20% of the European market in October. Overall, the five largest manufacturers sold 64.9% of all new cars in October:
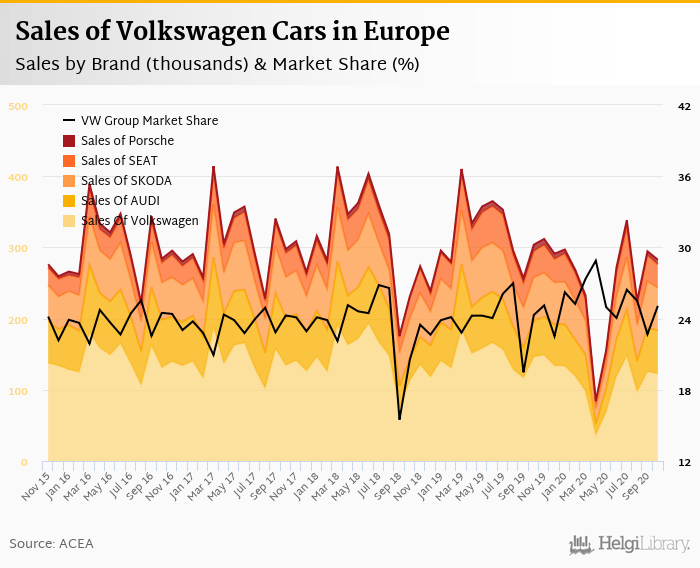
Volkswagen Group sold 283 thousand new passenger cars representing a 25.1% share of all new passenger cars sold in Europe in October 2020. This is 4.13% fewer vehicles and a 0.766 pp increase in market share when compared to last year. Looking back three years, VW's market share was 24.3%.
The Group sold 123 thousand of Volkswagen brand cars in October, followed by 60.8 thousand of Audis and 60.0 thousand of Skodas. Seat sold 32.7 thousand vehicles and Porsche some 6.58 thousand cars in October 2020:

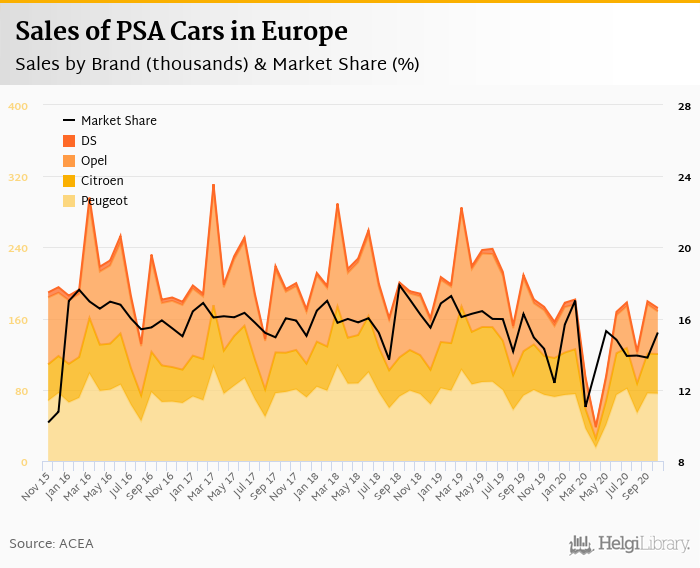
PSA Group sold 172 thousand new passenger cars representing a 15.2% share of all new passenger cars sold in Europe in October 2020. This is 5.33% fewer vehicles and a 0.278 pp increase in market share when compared to last year. By comparison, the market share three years ago stood at 16.0% and is down by 0.800 pp now.
The Group sold 75.8 thousand of Peugeots cars, followed by 47.8 thousand of Opels and 44.4 thousand of Citroens in October 2020:

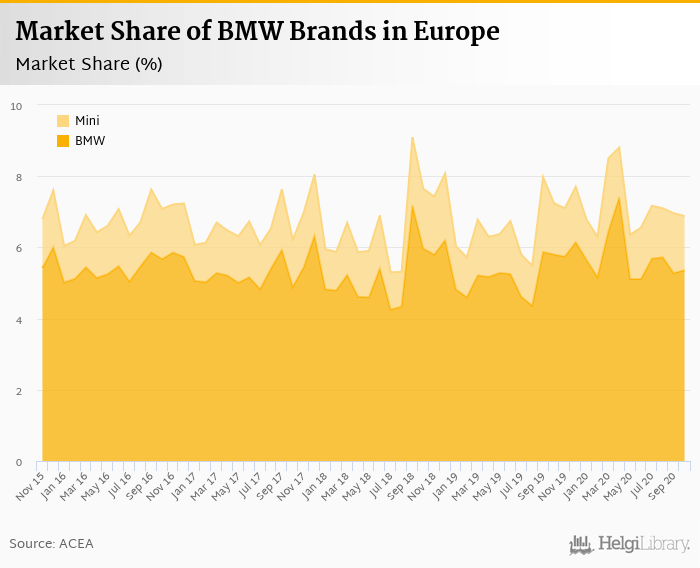
BMW Group sold 77.7 thousand new passenger cars representing a 6.88% share of all new passenger cars sold in Europe in October 2020. This is 11.7% fewer vehicles and a 0.365 pp decrease in market share when compared to last year. Compared to three years ago, BMW Group's market share is now 0.664 pp higher.
The group sold 60.5 thousand of BMW brand cars, followed by 17.2 thousand of Minis in October 2020:

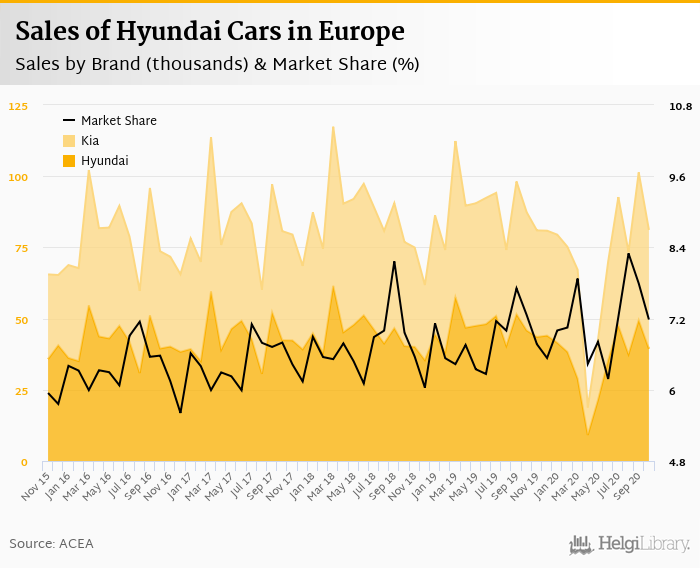
Hyundai Group sold 81.1 thousand new passenger cars representing a 7.18% share of all new passenger cars sold in Europe in October 2020. This is 8.02% fewer vehicles and a 0.075 pp decrease in market share when compared to last year. Compared to three years ago, Hyundai Group's market share is now 0.388 pp higher.
The group sold 41.7 thousand of Kia brand cars, followed by 39.4 thousand of Hyundais in October 2020:

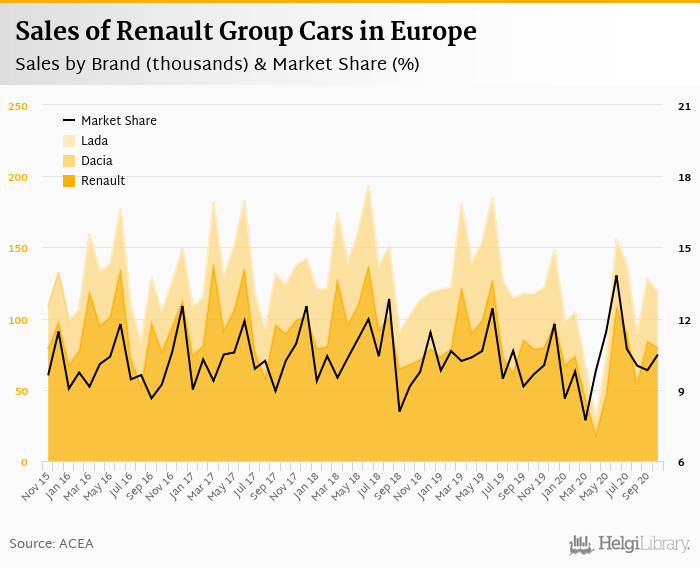
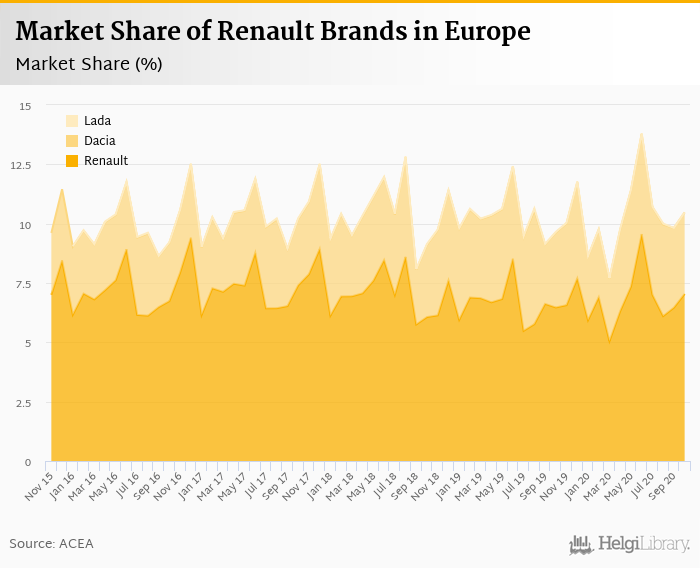
Renault Group sold 118 thousand new passenger cars representing a 10.5% share of all new passenger cars sold in Europe in October 2020. This is 0.945% more vehicles and a 0.831 pp increase in market share when compared to last year. By comparison, three years ago, Renault Group's market share was 10.2%.
The group sold 79.5 thousand of Renault brand cars in October, followed by 38.7 thousand of Dacias and 0.043 thousand of Ladas:
FCA Group sold 70.2 thousand new passenger cars representing a 6.21% share of all new passenger cars sold in Europe in October 2020. This is 3.77% more vehicles and a 0.648 pp increase in market share when compared to last year. By comparison, three years ago FCA Group's market share stood at 6.34%.
The group sold 49.5 thousand of Fiat brand cars in October, followed by 12.3 thousand of Jeeps and 3.42 thousand of Alfa-Romeos:


Toyota Group sold 63.7 thousand new passenger cars representing a 5.64% share of all new passenger cars sold in Europe in October 2020. This is 5.70% fewer vehicles and a 0.081 pp increase in market share when compared to last year. Toyota Group's market share three years ago, by comparison, stood at 4.78%.
The group sold 59.6 thousand of Toyota brand cars in October, with Lexus following at 4.10 thousand cars:


Jaguar Land Rover Group sold 13.5 thousand new passenger cars representing a 1.19% share of all new passenger cars sold in Europe in October 2020. This is 21.7% fewer vehicles and a 0.223 pp decrease in market share when compared to last year. Three years ago however, the market share of Jaguar Land Rover Group was 1.38%.
The group sold 3.31 thousand of Jaguars in October, followed by of s:


Daimler Group sold 79.2 thousand new passenger cars representing a 7.02% share of all new passenger cars sold in Europe in October 2020. This is 7.97% fewer vehicles and a 0.070 pp decrease in market share when compared to last year. By comparison, three years ago, Daimler Group's market share was 6.69%.
The group sold 75.5 thousand of Mercedes in October, followed by 3.74 thousand of Smart cars:


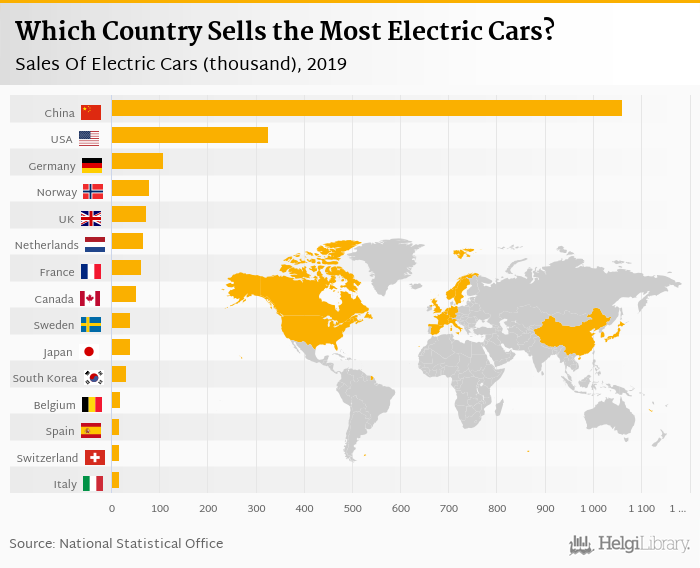
Based on a comparison of 138 countries, China ranked the highest with 21,444 thousand passenger cars sold in 2019 followed by the USA and Japan. Total sales of passenger cars reached 64,342 thousand in 2019 in the world, according to ACEA. This is 6.33% less than in the previous year and 29.6% more than 10 years ago. Historically, total sales of passenger cars reached an all time high of 70,695 thousand in 2017 and an all time low of 11,000 thousand in 1961. The average annual growth stands at 2.75% since 1960.
The top ranked country, China, accounted for 33.3% of all passenger cars sold in the world. The top 3 countries held a 47.3% share while the ten largest countries some 73.5% in 2019.
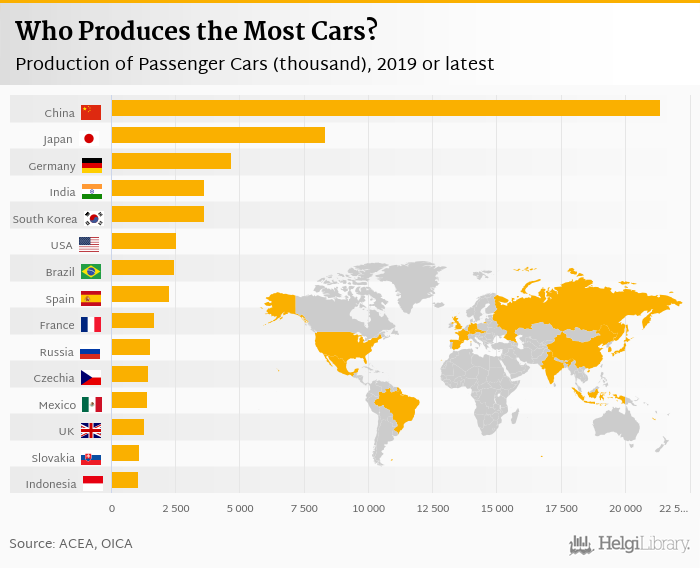
China was the largest car producer in 2019 with 21,360 thousand followed by Japan and Germany. Total production of passenger cars reached 67,149 thousand in 2019 in the world, according to ACEA. China accounted for 31.8% of the world's production, while the top 3 countries held a 51.2% share and the ten largest countries some 77.4% in 2019:

Based on a comparison of 39 countries, China ranked the highest in sales of electric cars with 1,060 thousand followed by USA and Germany in 2019. When looking at the ratio of electric to total new cars sold, Norway ranked the highest with 55.9% followed by Iceland and Netherlands:

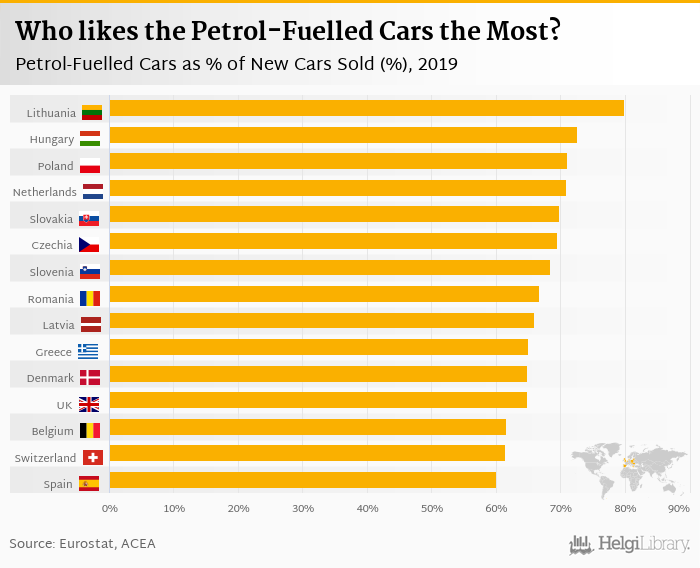
By contrast, Lithuania ranked the highest in the number of petrol-fuelled as a proportion of new cars sold with 79.9%, followed by Hungary and Poland. In terms of diesel-fuelled vehicles, Ireland ranked the highest with 46.6% followed by Bulgaria and Latvia:

In 2016, Switzerland ranked the highest in 4x4 drive cars as a share of new cars sold with 42.1% followed by Norway and Sweden. Switzerland ranked the highest in the average power of new cars sold with 122 kW followed by Luxembourg and Sweden:


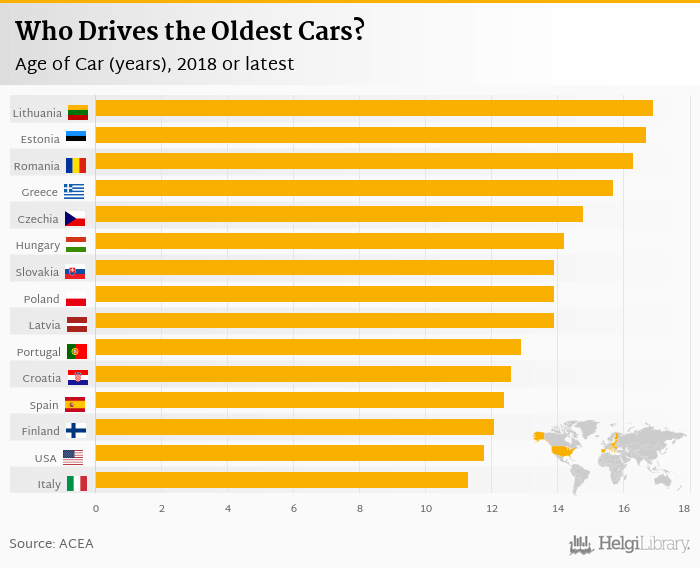
Based on the latest available data, Lithuania, Estonia and Romania were the countries with the oldest average age of passenger cars. The average age was an ancient 16.9 years in Lithuania, 16.7 years years for Estonia and 16.3 years years in Romania. On the other end of the scale was Austria with 8.20 years years, the United Kingdom with 8.20 years years and Luxembourg with 6.40 years years.
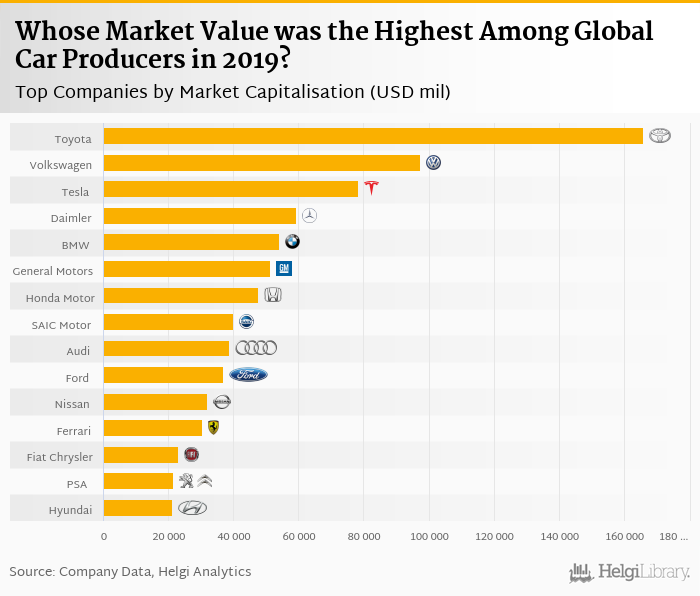
Based on a comparison of 27 firms among Global Car Producers, Volkswagen Group generated the highest sales in 2019 followed by Toyota Motor Corporation and Daimler Group. At the same time, Toyota Motor Corporation had the highest market value followed by Volkswagen Group and Tesla Inc.:

generated the highest earnings before interest costs, taxes and depreciation (so called EBITDA) in 2019 followed by and . At the same time, Ferrari generated the highest EBITDA Margin followed by Porsche AG and BMW Group.


Ferrari produced the highest net profit per car sold in 2019 followed by Porsche AG and Toyota Motor Corporation. Ferrari made a net profit of USD 77,831 for each car sold, down 21.7% compared to the previous year.


 Helgi Library