Sales of electrically-chargeable vehicles amounted to 666 thousand in 4Q2021, 81.8 thousand more than the last year.
Electric cars represented 28.3% of all new cars sold in 4Q2021, up from 19.2% a year ago.
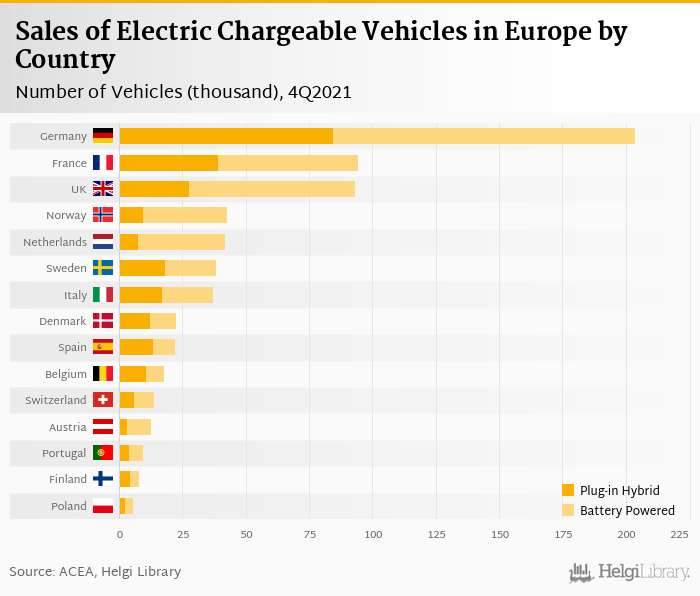
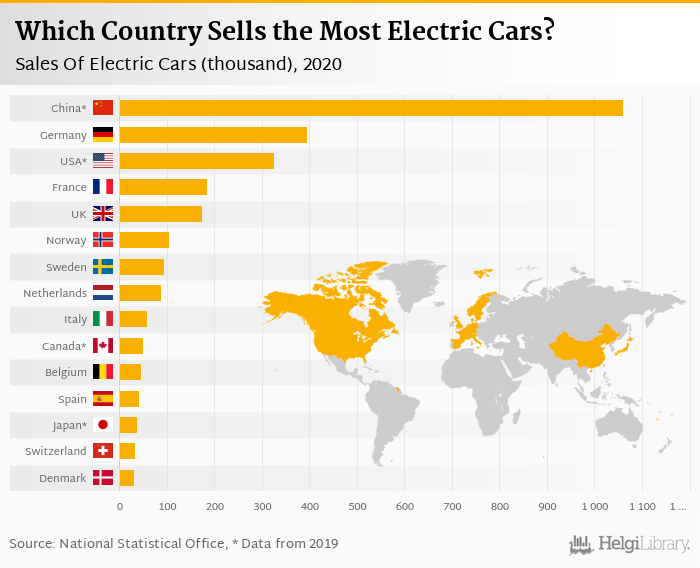
Most electric vehicles have been sold in Germany (204 thousand), while Lithuania registered the biggest increase in sales when compared to last year.
Sales of new electrically-chargeable passenger cars (battery electric and plug-in hybrid electric vehicles) reached 666 thousand in the fourth quarter of 2021 in the enlarged Europe (EU plus Iceland, Norway and Switzerland), according to ACEA. This is 14.0% more, or 584 thousand more than in the previous year.
Share of electric chargeable vehicles increased to 28.3% of all new passenger cars sold in 4Q2021, up from 19.2% seen in the fourth quarter of 2020. Most electric vehicles (204 thousand) were sold in Germany (up 6.98% yoy), followed by France (94.4 thousand, up 26.1%), the United Kingdom with 93.1 thousand thousand cars (up 40.6%), 42.8 thousand new vehicles were registered in Norway (up 12.1%) and 41.8 thousand in Netherlands (down 16.2%). The five largest countries accounted for 71.5% of total new vehicles registered in the fourth quarter of 2021:
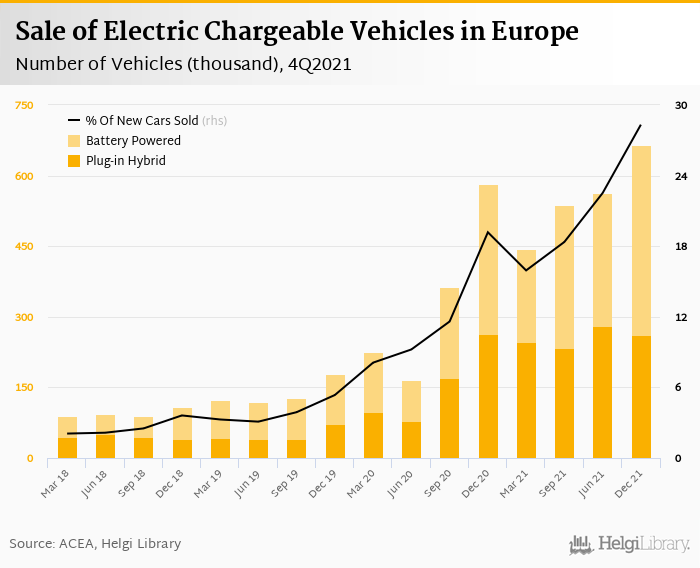
As partly seen above, the sale of battery-electric (BEV) increased by 26.5% when compared to last year, while registration of plug-in hybrid vehicles (PHEV) fell by 0.779%.
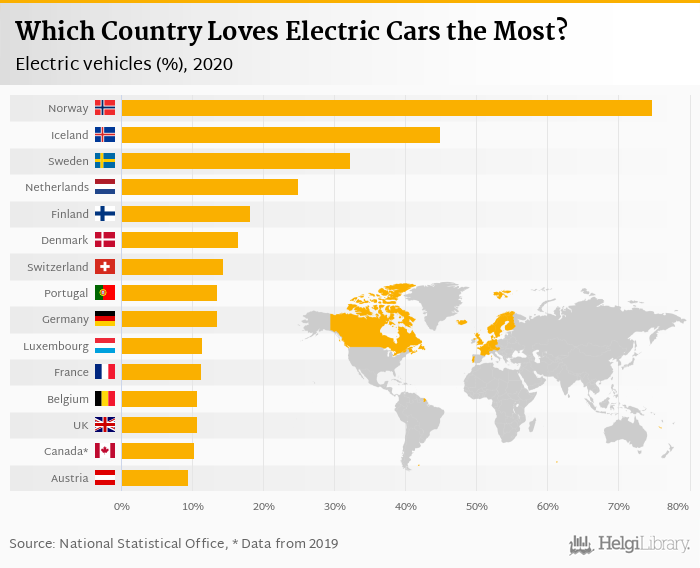
In relative terms, Norway liked the electric chargeable vehicles the most in the fourth quarter of 2021 with 90.2% of all new passenger cars sold followed by Iceland (76.8%) and Sweden (55.9%).
On the other end of the scale was Czech Republic with only 3.78%, Bulgaria with 2.53% and Cyprus with just 1.38% of electric cars sold, as % of total:


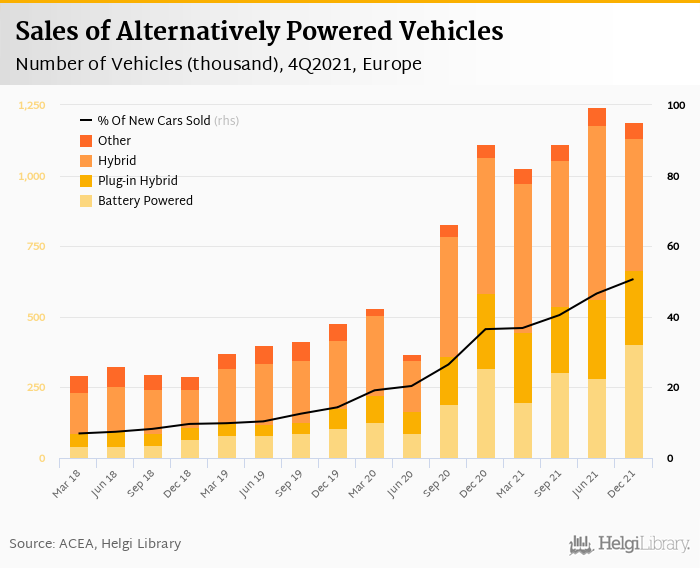
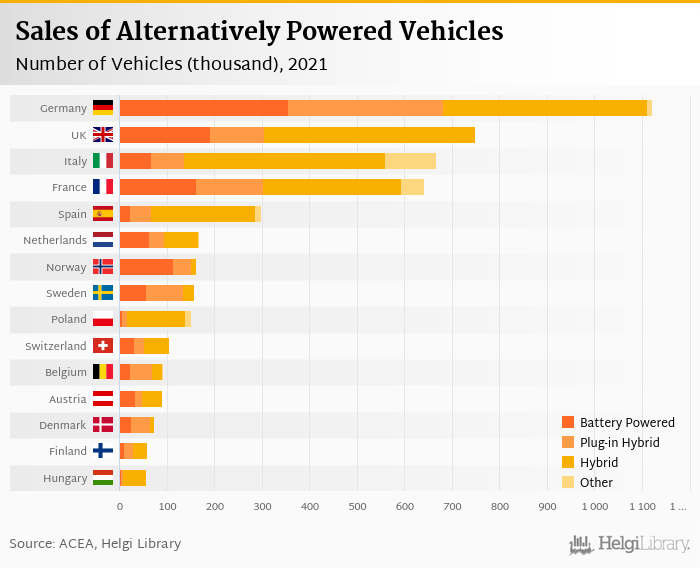
When hybrid electric vehicles (cars that combine a conventional internal combustion engine system with an electric propulsion system) and other alternatively-powered cars (such as natural gas vehicles (NGV), LPG-fueled vehicles and ethanol (E85) vehicles) are included, total sales of alternatively-powered cars (other than using diesel or petrol) amounted to 1,191 thousand vehicles in the fourth quarter of 2021. This is 7.21% more, or 80.1 thousand more than in the previous year.
Together with electric chargeable vehicles, the share of total alternatively-powered vehicles increased to 50.7% of all new passenger cars sold in 4Q2021, up from 36.5% seen in the fourth quarter of 2020:

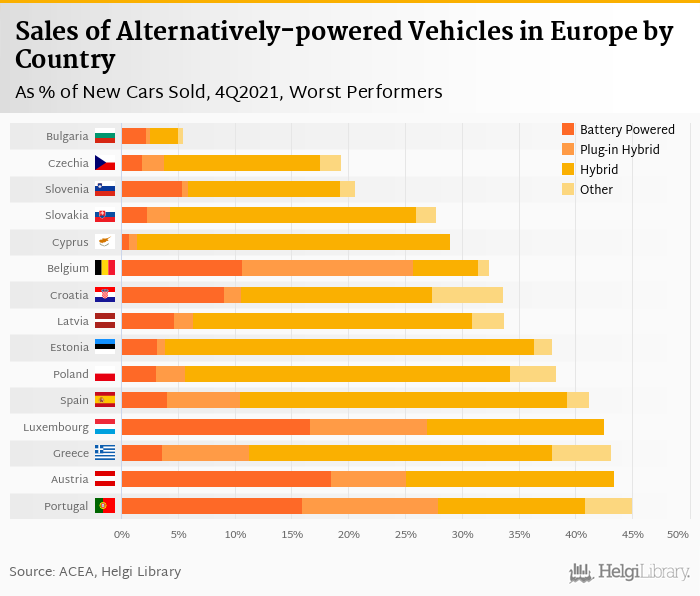
In relative terms, Norway liked the alternatively-powered vehicles the most in the fourth quarter of 2021 with 93.9% of all new passenger cars sold followed by Iceland (87.0%) and Netherlands (67.4%). On the other hand, alternatively-fuelled cars represented only 20.6% of all cars sold in Slovenia, 19.4% in the Czech Republic and 5.44% in Bulgaria, according to ACEA.

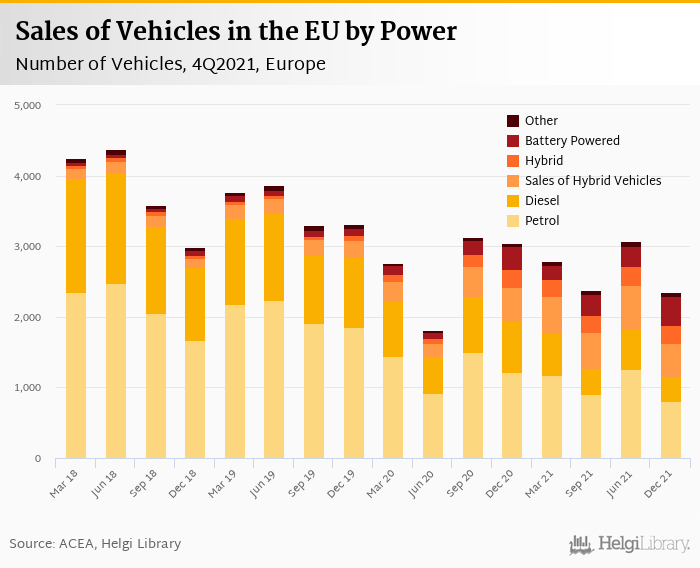
Sales of traditionally-powered vehicles using petrol and diesel reached 1,159 thousand in the fourth quarter of 2021 in the enlarged Europe, according to ACEA. This is 40.1%, or 775 thousand fewer than in the previous year.
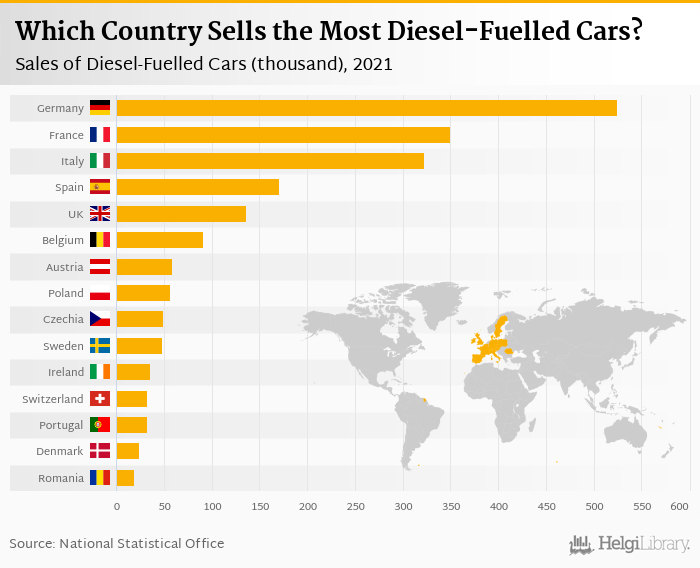
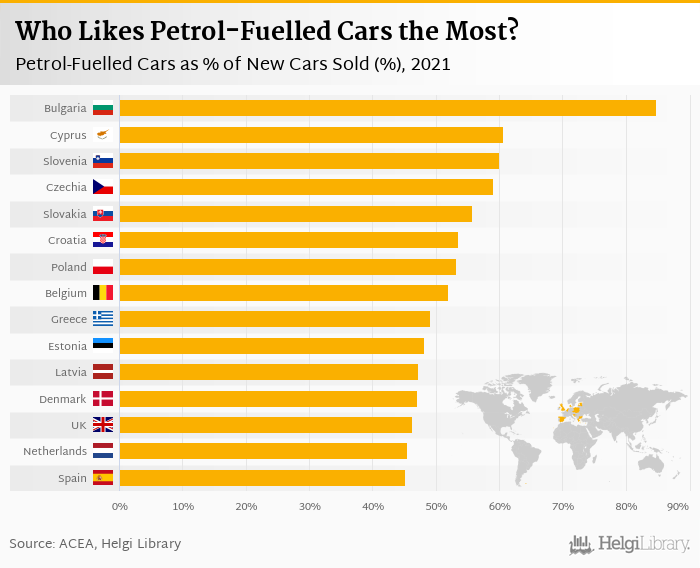
Some 813 thousand petrol-powered vehicles were sold, down 32.9% when compared to a year ago. The share decreased to 34.6% of all new passenger cars sold in 4Q2021, down from 39.8% seen in the fourth quarter of 2020. Share of diesel-powered cars fell to 14.7% (from 23.7% in 4Q2020) with 346 thousand cars sold in the fourth quarter of 2021.
As a result, share of traditionally-powered cars amounted to 49.3% of all new passenger cars sold in 4Q2021, down from 63.5% seen in the fourth quarter of 2020.

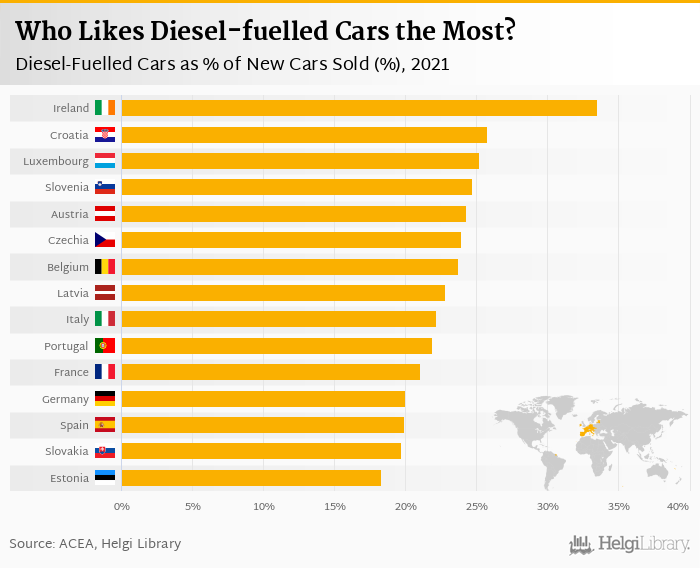
In relative terms, Bulgaria liked the petrol-fuelled vehicles the most in the fourth quarter of 2021 with 81.5% of all new passenger cars sold followed by Slovenia (59.7%) and the Czech Republic (57.3%). On the other hand, diesel-powered cars were preferred most in Ireland (25.7% of all cars sold), followed by Austria (with 23.8%) and the Czech Republic (23.3%).


The following charts show where the most cars are sold absolutely and relatively in Europe and elsewhere in the world:


| Country | 1Q2020 | 2Q2020 | 3Q2020 | 4Q2020 | 1Q2021 | 2Q2021 | 3Q2021 | 4Q2021 |
|---|---|---|---|---|---|---|---|---|
| Austria | 3.62 | 3.76 | 5.99 | 10.2 | 10.3 | 12.9 | 12.2 | 12.5 |
| Belgium | 7.69 | 6.36 | 12.4 | 19.9 | 16.8 | 18.4 | 17.4 | 17.9 |
| Bulgaria | ... | ... | ... | ... | 0.190 | 0.242 | 0.116 | 0.150 |
| Croatia | ... | ... | ... | 0.330 | 0.201 | 0.352 | 0.460 | 0.861 |
| Cyprus | 0.004 | 0.007 | 0.011 | 0.020 | 0.046 | 0.048 | 0.020 | 0.028 |
| Czechia | 1.32 | 0.681 | 0.908 | 2.33 | 1.54 | 1.94 | 1.47 | 1.70 |
| Denmark | 4.16 | 4.11 | 10.2 | 14.1 | 10.5 | 15.3 | 17.2 | 22.4 |
| Estonia | 0.065 | 0.070 | 0.118 | 0.172 | 0.127 | 0.226 | 0.150 | 0.148 |
| Finland | 4.56 | 2.73 | 4.93 | 5.20 | 7.24 | 8.87 | 6.29 | 7.89 |
| France | 35.4 | 29.8 | 45.7 | 74.8 | 61.7 | 82.6 | 64.5 | 94.4 |
| Germany | 52.4 | 41.5 | 111 | 190 | 143 | 170 | 166 | 204 |
| Greece | 0.159 | 0.208 | 0.515 | 1.25 | 1.30 | 1.91 | 1.60 | 2.16 |
| Hungary | 1.00 | 0.903 | 1.60 | 2.53 | 1.48 | 1.79 | 2.26 | 3.02 |
| Iceland | 1.17 | 0.651 | 1.16 | 1.23 | 1.08 | 1.60 | 2.01 | 2.30 |
| Ireland | 2.69 | 0.373 | 2.90 | 0.553 | 5.55 | 2.95 | 6.78 | 1.27 |
| Italy | 8.35 | 7.39 | 14.2 | 29.9 | 29.4 | 38.6 | 32.1 | 37.2 |
| Latvia | 0.066 | 0.074 | 0.147 | 0.104 | 0.094 | 0.170 | 0.124 | 0.174 |
| Lithuania | 0.087 | 0.074 | 0.167 | 0.125 | 0.065 | 0.245 | 0.273 | 0.572 |
| Luxembourg | 0.790 | 0.712 | 1.49 | 2.17 | 2.27 | 2.21 | 2.10 | 2.52 |
| Netherlands | 12.0 | 8.14 | 19.1 | 49.9 | 10.8 | 19.9 | 21.2 | 41.8 |
| Norway | 22.6 | 18.0 | 27.0 | 38.2 | 29.8 | 39.6 | 39.8 | 42.8 |
| Poland | 1.28 | 1.22 | 2.06 | 3.54 | 2.93 | 4.04 | 3.92 | 5.61 |
| Portugal | 4.78 | 2.64 | 4.73 | 7.55 | 4.98 | 7.57 | 6.86 | 9.51 |
| Romania | 0.271 | 0.328 | 0.807 | 1.44 | 0.415 | 0.459 | 1.95 | 5.34 |
| Slovakia | 0.324 | 0.310 | 0.474 | 0.376 | 0.397 | 0.595 | 0.553 | 0.726 |
| Slovenia | 0.387 | 0.323 | 0.402 | 0.664 | 0.364 | 0.406 | 0.495 | 0.640 |
| Spain | 7.25 | 3.49 | 10.4 | 20.1 | 10.6 | 17.8 | 16.5 | 22.1 |
| Sweden | 18.5 | 14.1 | 24.0 | 37.5 | 32.4 | 36.8 | 27.9 | 38.3 |
| Switzerland | 5.42 | 4.70 | 9.11 | 14.7 | 9.07 | 13.6 | 17.2 | 13.8 |
| UK | 31.9 | 18.5 | 58.4 | 66.2 | 58.4 | 73.7 | 80.1 | 93.1 |
| EU | 223 | 167 | 363 | 584 | 445 | 564 | 537 | 666 |
| Country | 1Q2020 | 2Q2020 | 3Q2020 | 4Q2020 | 1Q2021 | 2Q2021 | 3Q2021 | 4Q2021 |
|---|---|---|---|---|---|---|---|---|
| Austria | 4.41 | 5.11 | 7.21 | 9.29 | 10.2 | 12.4 | 10.3 | 9.14 |
| Belgium | 5.60 | 2.87 | 3.85 | 2.88 | 5.40 | 5.29 | 4.98 | 4.01 |
| Bulgaria | 0.501 | 0.212 | 0.120 | 0.114 | 0.510 | 0.418 | 0.167 | 0.150 |
| Croatia | 0.486 | 0.422 | 0.551 | 0.721 | 1.37 | 2.02 | 1.67 | 1.38 |
| Cyprus | 0.400 | 0.336 | 0.295 | 0.364 | 0.428 | 0.736 | 0.817 | 0.562 |
| Czechia | 2.38 | 2.27 | 3.02 | 4.95 | 5.41 | 7.64 | 4.88 | 6.18 |
| Denmark | 2.32 | 1.67 | 2.60 | 3.05 | 2.15 | 2.71 | 2.10 | 1.88 |
| Estonia | 0.738 | 0.484 | 0.684 | 0.759 | 1.45 | 2.01 | 1.70 | 1.23 |
| Finland | 5.09 | 3.13 | 5.19 | 5.32 | 8.17 | 8.10 | 6.69 | 5.15 |
| France | 30.1 | 30.4 | 49.3 | 59.1 | 70.8 | 82.4 | 63.9 | 72.8 |
| Germany | 63.1 | 46.5 | 96.4 | 121 | 101 | 120 | 113 | 95.1 |
| Greece | 2.59 | 2.12 | 3.25 | 3.79 | 5.06 | 7.32 | 5.90 | 5.11 |
| Hungary | 5.68 | 5.18 | 9.14 | 11.8 | 12.9 | 12.6 | 11.6 | 11.0 |
| Iceland | 0.298 | 0.249 | 0.404 | 0.223 | 0.331 | 0.926 | 0.712 | 0.302 |
| Ireland | 6.34 | 0.276 | 4.07 | 0.308 | 9.22 | 2.70 | 6.60 | 0.739 |
| Italy | 34.8 | 27.6 | 62.9 | 96.7 | 121 | 123 | 85.5 | 93.8 |
| Latvia | 0.496 | 0.340 | 0.542 | 0.518 | 0.777 | 1.10 | 1.07 | 0.678 |
| Lithuania | 1.08 | 0.825 | 4.20 | 2.18 | 3.39 | 4.74 | 2.70 | 1.59 |
| Luxembourg | 0.853 | 0.698 | 1.10 | 1.15 | 1.77 | 2.16 | 1.84 | 1.46 |
| Netherlands | 11.5 | 6.87 | 13.6 | 15.5 | 19.2 | 19.0 | 17.5 | 16.1 |
| Norway | 3.25 | 2.56 | 2.89 | 3.55 | 2.57 | 3.42 | 2.06 | 1.73 |
| Poland | 13.7 | 9.47 | 17.2 | 25.9 | 29.7 | 33.1 | 30.9 | 28.4 |
| Portugal | 2.83 | 1.50 | 2.94 | 4.64 | 4.13 | 6.39 | 4.15 | 4.42 |
| Romania | 2.25 | 2.27 | 4.08 | 5.67 | 5.52 | 6.96 | 10.4 | 7.88 |
| Slovakia | 1.33 | 1.26 | 2.00 | 2.64 | 2.61 | 4.64 | 4.23 | 3.68 |
| Slovenia | 0.571 | 0.317 | 0.415 | 0.416 | 0.651 | 0.935 | 1.42 | 1.46 |
| Spain | 29.4 | 16.7 | 40.3 | 51.0 | 41.0 | 66.8 | 50.6 | 61.0 |
| Sweden | 4.43 | 3.72 | 7.05 | 7.15 | 6.14 | 7.01 | 4.72 | 4.32 |
| Switzerland | 7.09 | 4.71 | 7.88 | 12.5 | 11.6 | 14.1 | 13.1 | 13.4 |
| UK | 68.1 | 23.2 | 114 | 84.4 | 109 | 133 | 123 | 78.8 |
| EU | 282 | 180 | 425 | 482 | 529 | 615 | 517 | 469 |
| Country | 1Q2020 | 2Q2020 | 3Q2020 | 4Q2020 | 1Q2021 | 2Q2021 | 3Q2021 | 4Q2021 |
|---|---|---|---|---|---|---|---|---|
| Austria | 0.005 | 0.003 | 0.001 | 0.012 | 0.025 | 0.036 | 0.018 | 0.007 |
| Belgium | 0.049 | 0.342 | 0.410 | 0.193 | 0.843 | 0.894 | 0.721 | 0.629 |
| Bulgaria | 0.086 | 0.034 | 0 | 0.001 | 0.053 | 0.027 | 0 | 0.023 |
| Croatia | 0.064 | 0.101 | 0.225 | 0.324 | 0.327 | 0.581 | 0.579 | 0.510 |
| Cyprus | 0 | 0 | 0 | 0 | 0 | 0 | 0.001 | 0 |
| Czechia | 0.105 | 0.168 | 1.53 | 0.592 | 0.507 | 0.913 | 2.19 | 0.856 |
| Denmark | 0 | 0 | 0 | 0 | 0 | 0 | 0 | 0 |
| Estonia | 0 | 0 | 0 | 0 | 0.188 | 0.095 | 0.121 | 0.062 |
| Finland | 0 | 0 | 0 | 0 | 0.307 | 0.275 | 0.193 | 0.146 |
| France | 0.506 | 3.49 | 6.71 | 5.89 | 9.42 | 12.8 | 13.6 | 13.2 |
| Germany | 0.180 | 0.732 | 2.38 | 3.27 | 2.51 | 3.71 | 3.27 | 4.56 |
| Greece | 0 | 0.014 | 0.132 | 0.295 | 0.533 | 0.884 | 0.986 | 0.991 |
| Hungary | 0 | 0.018 | 0.175 | 0.140 | 0.206 | 0.056 | 0.211 | 0.239 |
| Iceland | 0 | 0 | 0 | 0.001 | 0.001 | 0.001 | 0.001 | 0.004 |
| Ireland | 0 | 0 | 0 | 0 | 0 | 0 | 0.179 | 0.017 |
| Italy | 20.9 | 16.2 | 26.7 | 29.7 | 36.4 | 40.8 | 31.3 | 29.7 |
| Latvia | 0.012 | 0.042 | 0.024 | 0.058 | 0.042 | 0.075 | 0.085 | 0.077 |
| Lithuania | 0 | 0 | 0.022 | 0.051 | 0 | 0.076 | 0.101 | 0.090 |
| Luxembourg | 0 | 0 | 0 | 0 | 0 | 0.001 | 0.002 | 0 |
| Netherlands | 0.090 | 0.341 | 0.758 | 0.732 | 0.399 | 0.576 | 0.565 | 0.718 |
| Norway | 0 | 0 | 0 | 0 | 0 | 0 | 0 | 0 |
| Poland | 0.643 | 1.19 | 2.69 | 4.82 | 3.11 | 3.18 | 3.32 | 4.05 |
| Portugal | 0.094 | 0.348 | 0.466 | 0.907 | 0.435 | 0.734 | 0.965 | 1.42 |
| Romania | 0.093 | 1.07 | 2.87 | 5.25 | 1.67 | 2.91 | 6.85 | 4.52 |
| Slovakia | 0.042 | 0.120 | 0.187 | 0.193 | 0.217 | 0.303 | 0.357 | 0.311 |
| Slovenia | 0.004 | 0.046 | 0.058 | 0.076 | 0.123 | 0.160 | 0.144 | 0.145 |
| Spain | 0.988 | 1.08 | 3.57 | 4.24 | 2.56 | 3.11 | 4.28 | 4.10 |
| Sweden | 0.001 | 0.003 | 0.007 | 0 | 0.416 | 0.693 | 0.835 | 0.725 |
| Switzerland | 0.001 | 0.001 | 0.001 | 0 | 0.066 | 0.085 | 0.041 | 0.097 |
| UK | 0 | 0 | 0 | 0 | 0 | 0 | 0 | 0 |
| EU | 22.8 | 22.6 | 41.1 | 45.2 | 54.0 | 64.6 | 57.0 | 56.3 |
| Country | 1Q2020 | 2Q2020 | 3Q2020 | 4Q2020 | 1Q2021 | 2Q2021 | 3Q2021 | 4Q2021 |
|---|---|---|---|---|---|---|---|---|
| Austria | 21.3 | 21.6 | 18.3 | 22.5 | 16.3 | 17.8 | 12.3 | 11.9 |
| Belgium | 40.6 | 29.0 | 39.4 | 33.2 | 32.1 | 27.4 | 16.9 | 14.5 |
| Bulgaria | 2.34 | 1.50 | 0.910 | 0.677 | 1.93 | 2.69 | 0.889 | 0.774 |
| Croatia | 3.46 | 2.63 | 4.03 | 2.77 | 3.09 | 3.99 | 2.83 | 1.67 |
| Cyprus | 0.901 | 0.610 | 0.807 | 0.624 | 0.606 | 0.368 | 0.332 | 0.279 |
| Czechia | 14.6 | 12.0 | 16.1 | 16.3 | 14.1 | 14.9 | 9.56 | 10.5 |
| Denmark | 13.0 | 8.73 | 10.4 | 12.6 | 7.04 | 7.39 | 4.76 | 4.72 |
| Estonia | 1.28 | 0.812 | 1.32 | 1.23 | 1.42 | 1.35 | 0.737 | 0.580 |
| Finland | 3.95 | 2.95 | 3.21 | 2.68 | 2.61 | 2.62 | 1.88 | 1.28 |
| France | 121 | 102 | 139 | 142 | 108 | 105 | 64.0 | 73.0 |
| Germany | 224 | 159 | 227 | 210 | 158 | 156 | 112 | 97.8 |
| Greece | 5.79 | 4.31 | 5.78 | 6.37 | 5.05 | 5.85 | 3.69 | 2.97 |
| Hungary | 6.95 | 4.83 | 7.67 | 8.17 | 6.01 | 5.56 | 4.25 | 3.20 |
| Iceland | 0.452 | 0.364 | 0.687 | 0.300 | 0.332 | 0.600 | 0.342 | 0.275 |
| Ireland | 21.9 | 1.49 | 13.0 | 1.86 | 17.6 | 5.43 | 11.0 | 1.08 |
| Italy | 119 | 84.5 | 132 | 117 | 112 | 99.0 | 58.3 | 53.5 |
| Latvia | 1.46 | 0.879 | 1.21 | 1.07 | 1.00 | 0.863 | 0.758 | 0.586 |
| Lithuania | 1.49 | 0.946 | 1.77 | 2.75 | 0.950 | 1.40 | 0.909 | 0.724 |
| Luxembourg | 4.60 | 3.34 | 4.80 | 3.89 | 3.77 | 3.26 | 2.09 | 2.08 |
| Netherlands | 5.46 | 2.64 | 3.18 | 1.69 | 2.17 | 2.43 | 1.47 | 0.898 |
| Norway | 3.49 | 3.21 | 3.10 | 2.37 | 2.09 | 2.20 | 1.36 | 1.44 |
| Poland | 19.7 | 13.2 | 21.9 | 24.4 | 17.1 | 17.1 | 11.7 | 11.4 |
| Portugal | 15.7 | 6.33 | 13.6 | 12.2 | 8.16 | 10.9 | 6.05 | 6.91 |
| Romania | 8.30 | 6.19 | 8.39 | 11.0 | 3.74 | 5.35 | 6.19 | 3.93 |
| Slovakia | 4.99 | 3.55 | 5.49 | 5.06 | 4.04 | 4.38 | 3.53 | 2.96 |
| Slovenia | 4.81 | 4.50 | 4.96 | 3.54 | 4.82 | 3.84 | 2.53 | 2.14 |
| Spain | 59.7 | 36.2 | 70.0 | 70.0 | 42.8 | 53.0 | 34.9 | 40.5 |
| Sweden | 16.6 | 15.9 | 15.9 | 16.0 | 19.5 | 12.9 | 7.73 | 8.19 |
| Switzerland | 16.0 | 7.99 | 13.7 | 14.2 | 9.36 | 10.0 | 6.49 | 6.55 |
| UK | 91.4 | 27.5 | 90.1 | 52.7 | 48.6 | 44.5 | 24.5 | 18.2 |
| EU | 783 | 517 | 803 | 722 | 595 | 567 | 370 | 346 |
| Country | 1Q2020 | 2Q2020 | 3Q2020 | 4Q2020 | 1Q2021 | 2Q2021 | 3Q2021 | 4Q2021 |
|---|---|---|---|---|---|---|---|---|
| Austria | 25.2 | 27.5 | 29.0 | 26.0 | 26.6 | 27.7 | 20.8 | 16.4 |
| Belgium | 72.5 | 50.1 | 60.1 | 41.0 | 64.1 | 61.2 | 41.2 | 32.5 |
| Bulgaria | 2.86 | 2.35 | 5.82 | 4.44 | 2.97 | 3.97 | 5.50 | 4.84 |
| Croatia | 5.84 | 4.27 | 5.91 | 3.79 | 5.50 | 8.86 | 5.93 | 3.75 |
| Cyprus | 1.62 | 1.04 | 1.61 | 1.43 | 1.64 | 1.82 | 1.62 | 1.17 |
| Czechia | 31.3 | 29.0 | 31.5 | 30.2 | 28.0 | 37.8 | 30.9 | 25.8 |
| Denmark | 29.3 | 25.0 | 30.6 | 26.3 | 24.2 | 27.2 | 19.4 | 16.4 |
| Estonia | 3.27 | 1.97 | 2.87 | 2.21 | 2.54 | 3.53 | 2.89 | 1.78 |
| Finland | 13.9 | 9.85 | 12.2 | 9.60 | 9.65 | 8.88 | 6.87 | 5.35 |
| France | 178 | 185 | 210 | 201 | 192 | 198 | 132 | 145 |
| Germany | 359 | 260 | 393 | 350 | 252 | 285 | 232 | 203 |
| Greece | 12.5 | 8.27 | 13.4 | 8.93 | 11.5 | 19.0 | 11.2 | 7.93 |
| Hungary | 19.0 | 12.1 | 15.8 | 15.3 | 11.6 | 12.5 | 11.4 | 9.95 |
| Iceland | 0.544 | 0.442 | 0.807 | 0.348 | 0.347 | 0.824 | 0.677 | 0.112 |
| Ireland | 18.9 | 0.953 | 11.7 | 1.09 | 15.7 | 4.75 | 12.2 | 1.09 |
| Italy | 156 | 96.0 | 137 | 133 | 149 | 137 | 73.3 | 78.1 |
| Latvia | 1.83 | 1.39 | 1.92 | 1.36 | 1.53 | 2.06 | 1.90 | 1.24 |
| Lithuania | 8.07 | 4.24 | 5.28 | 6.87 | 3.19 | 4.55 | 3.66 | 2.12 |
| Luxembourg | 5.67 | 4.13 | 5.86 | 3.94 | 4.66 | 5.21 | 3.69 | 3.30 |
| Netherlands | 74.0 | 36.9 | 53.9 | 40.3 | 46.8 | 40.7 | 32.5 | 27.5 |
| Norway | 3.05 | 3.10 | 3.17 | 1.96 | 1.85 | 2.41 | 1.75 | 1.47 |
| Poland | 72.3 | 47.1 | 71.4 | 74.5 | 65.1 | 67.8 | 55.3 | 49.9 |
| Portugal | 21.9 | 8.75 | 19.1 | 14.5 | 13.3 | 24.8 | 13.1 | 11.9 |
| Romania | 17.1 | 11.8 | 18.8 | 18.4 | 7.73 | 11.3 | 16.1 | 12.2 |
| Slovakia | 12.2 | 9.71 | 13.4 | 12.0 | 8.14 | 13.1 | 11.6 | 9.31 |
| Slovenia | 8.83 | 8.31 | 9.39 | 5.77 | 9.68 | 8.72 | 7.50 | 6.51 |
| Spain | 120 | 63.2 | 130 | 110 | 89.1 | 130 | 84.8 | 83.9 |
| Sweden | 25.6 | 25.3 | 29.0 | 27.8 | 32.4 | 24.9 | 18.1 | 17.1 |
| Switzerland | 35.1 | 21.8 | 29.6 | 31.8 | 26.4 | 30.2 | 22.3 | 21.0 |
| UK | 292 | 101 | 327 | 184 | 209 | 233 | 179 | 141 |
| EU | 1,444 | 927 | 1,496 | 1,212 | 1,169 | 1,262 | 905 | 813 |

 Helgi Library