Sales of electrically-chargeable vehicles amounted to 584 thousand in 4Q2020, 406 thousand more than the last year.
Electric cars represented 19.6% of all new cars sold in 4Q2020, up from 5.35% a year ago.
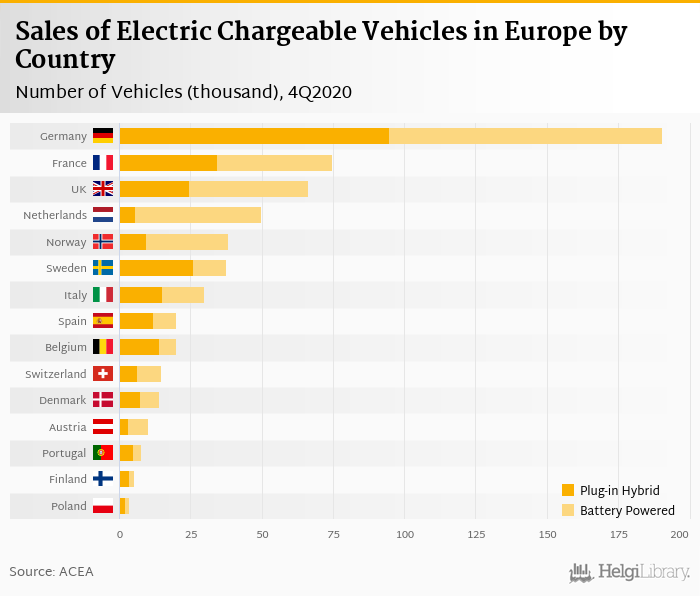
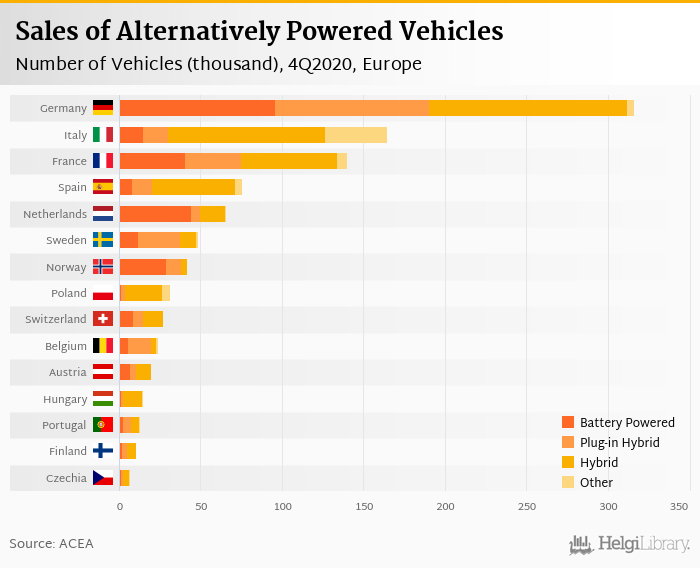
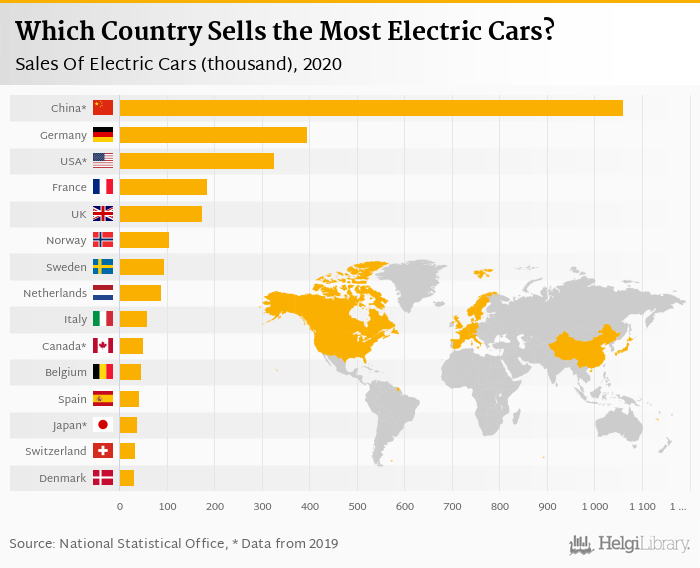
Most electric vehicles have been sold in Germany (190 thousand), while Slovenia registered the biggest increase in sales when compared to last year.
Sales of new electrically-chargeable passenger cars (battery electric and plug-in hybrid electric vehicles) reached 584 thousand in the fourth quarter of 2020 in the enlarged Europe (EU plus Iceland, Norway and Switzerland), according to ACEA. This is 229% more, or 178 thousand more than in the previous year.
Share of electric chargeable vehicles increased to 19.6% of all new passenger cars sold in 4Q2020, up from 5.35% seen in the fourth quarter of 2019. Most electric vehicles (190 thousand) were sold in Germany (up 455% yoy), followed by France (74.8 thousand, up 291%), the United Kingdom with 66.2 thousand thousand cars (up 168%), 49.9 thousand new vehicles were registered in Netherlands (up 51.8%) and 38.2 thousand in Norway (up 111%). The five largest countries accounted for 71.9% of total new vehicles registered in the fourth quarter of 2020:
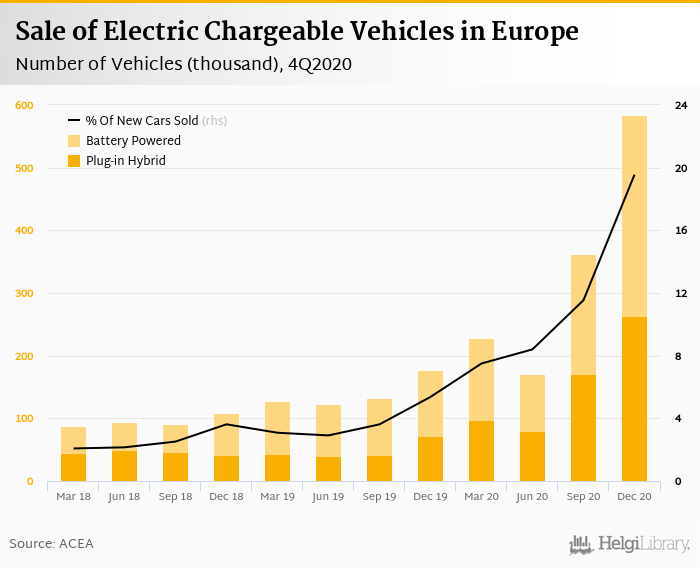
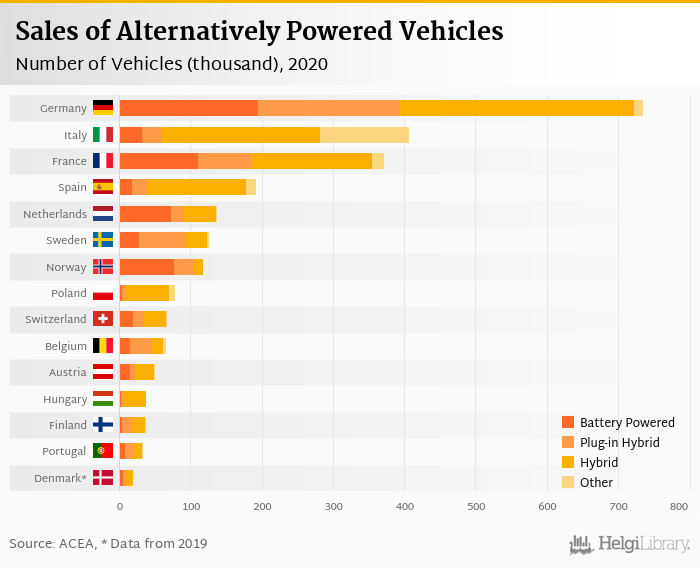
As partly seen above, the sale of battery-electric (BEV) increased by 205% when compared to last year, while registration of plug-in hybrid vehicles (PHEV) rose by 262%.
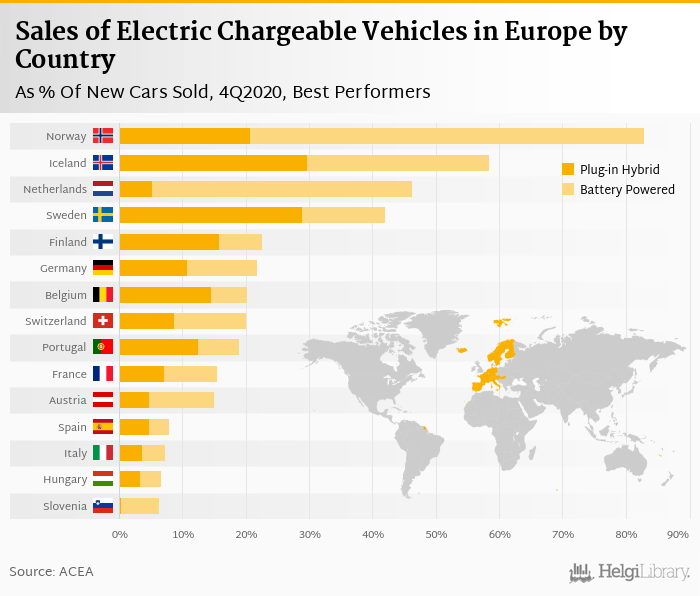
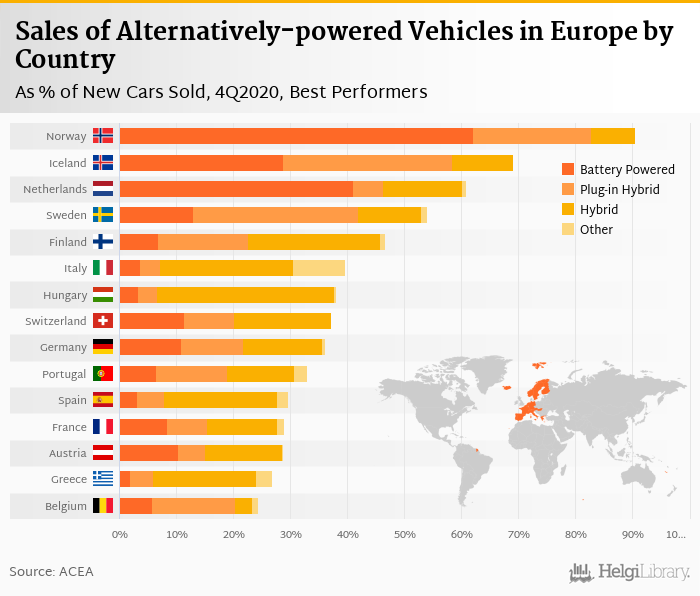
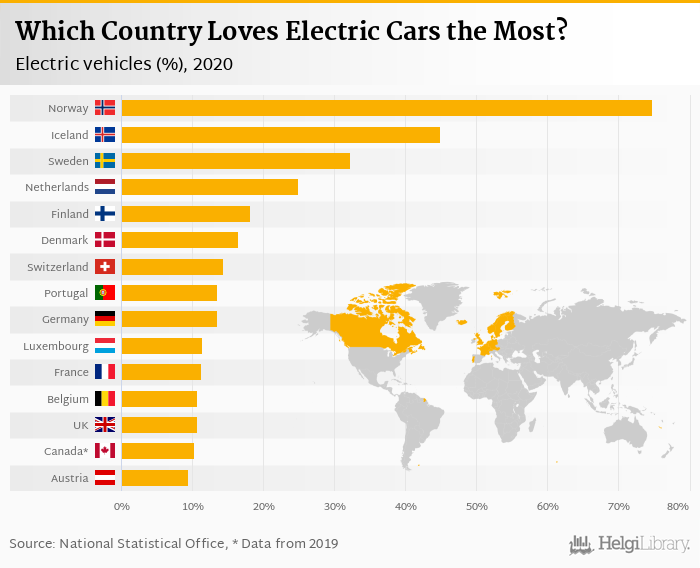
In relative terms, Norway liked the electric chargeable vehicles the most in the fourth quarter of 2020 with 82.9% of all new passenger cars sold followed by Iceland (58.5%) and Netherlands (46.3%).
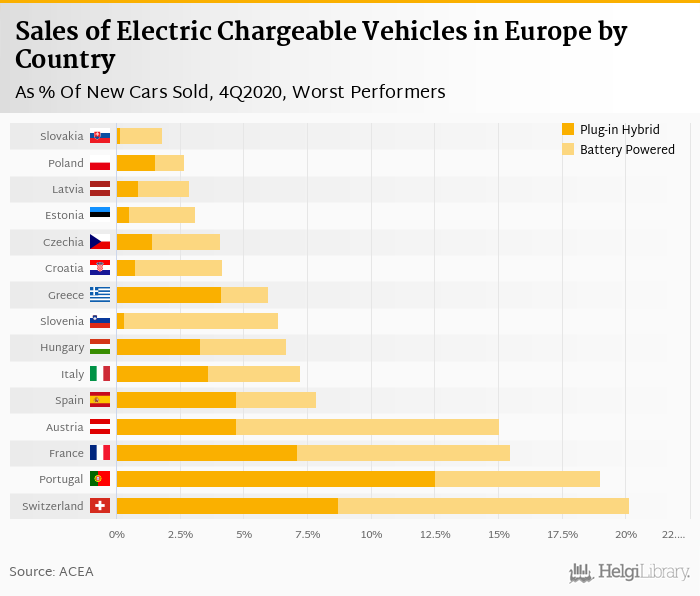
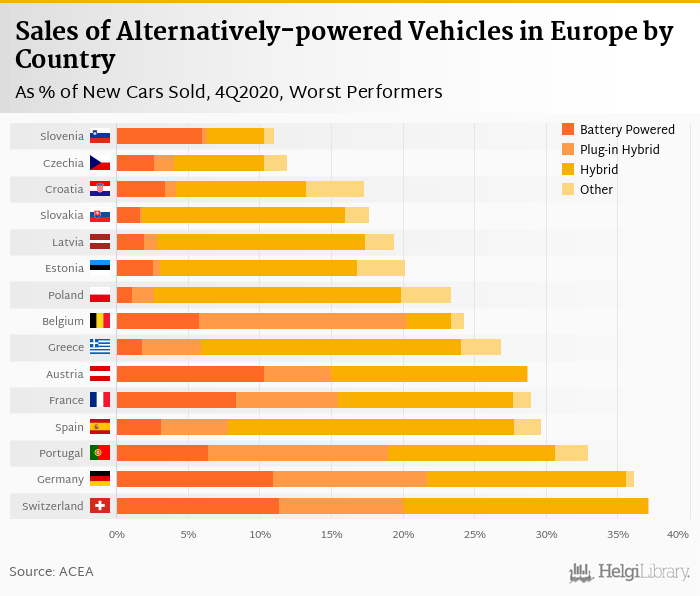
On the other end of the scale was Latvia with only 2.85%, Poland with 2.66% and Slovakia with just 1.82% of electric cars sold, as % of total:
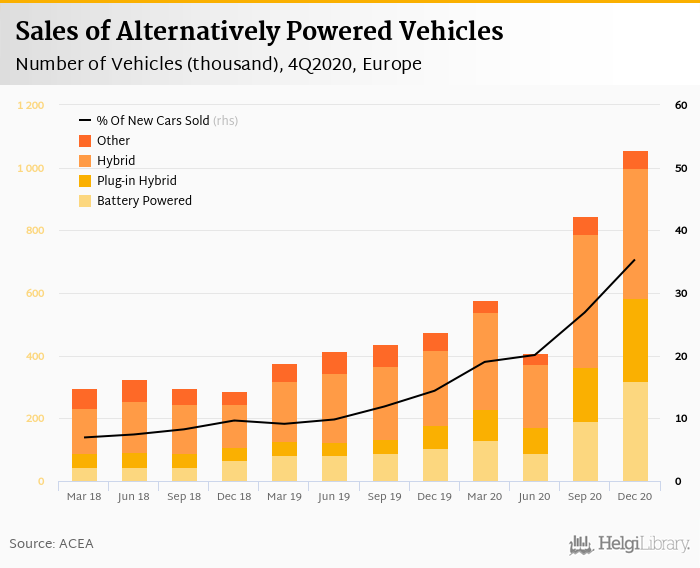
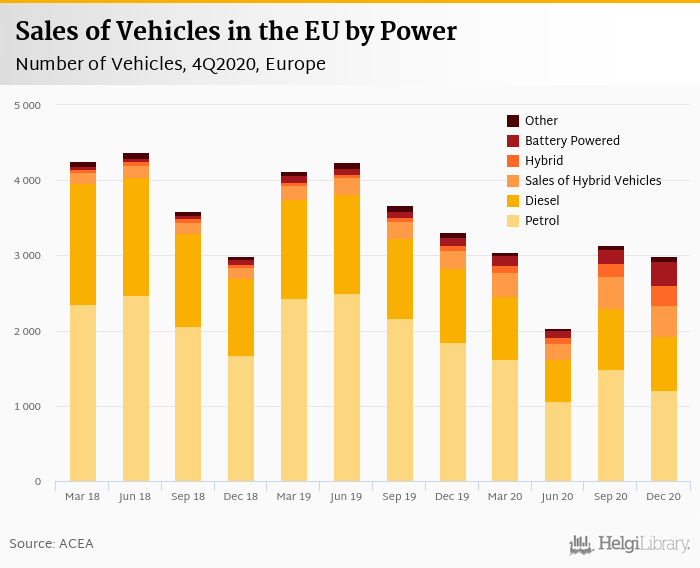
When hybrid electric vehicles (cars that combine a conventional internal combustion engine system with an electric propulsion system) and other alternatively-powered cars (such as natural gas vehicles (NGV), LPG-fueled vehicles and ethanol (E85) vehicles) are included, total sales of alternatively-powered cars (other than using diesel or petrol) amounted to 1,056 thousand vehicles in the fourth quarter of 2020. This is 121% more, or 579 thousand more than in the previous year.
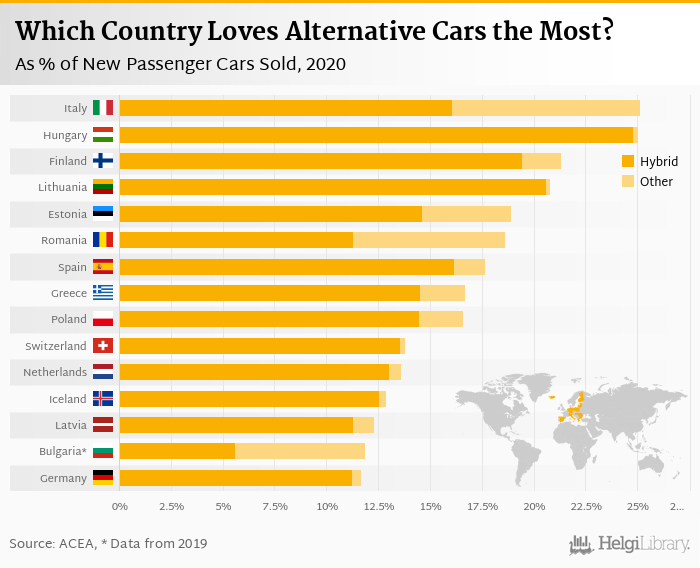
Together with electric chargeable vehicles, the share of total alternatively-powered vehicles increased to 35.3% of all new passenger cars sold in 4Q2020, up from 14.4% seen in the fourth quarter of 2019:
In relative terms, Norway liked the alternatively-powered vehicles the most in the fourth quarter of 2020 with 90.6% of all new passenger cars sold followed by Iceland (69.2%) and Netherlands (60.9%). On the other hand, alternatively-fuelled cars represented only 17.3% of all cars sold in Croatia, 11.9% in the Czech Republic and 11.0% in Slovenia, according to ACEA.
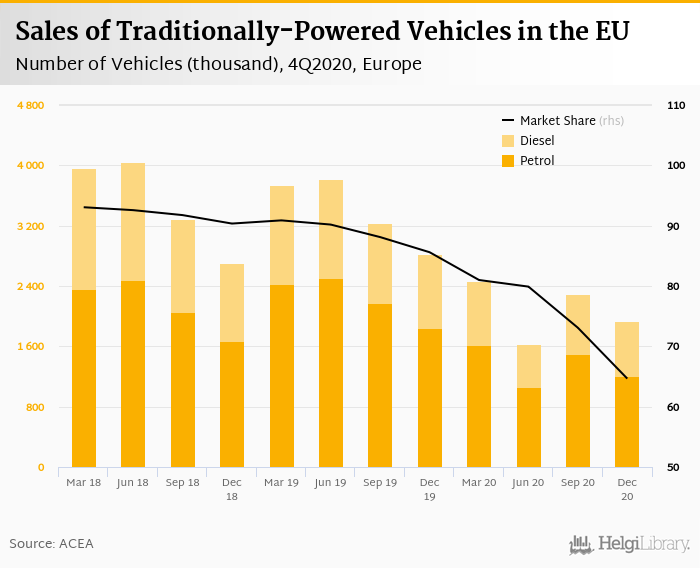
Sales of traditionally-powered vehicles using petrol and diesel reached 1,931 thousand in the fourth quarter of 2020 in the enlarged Europe, according to ACEA. This is 32.1%, or 911 thousand fewer than in the previous year.
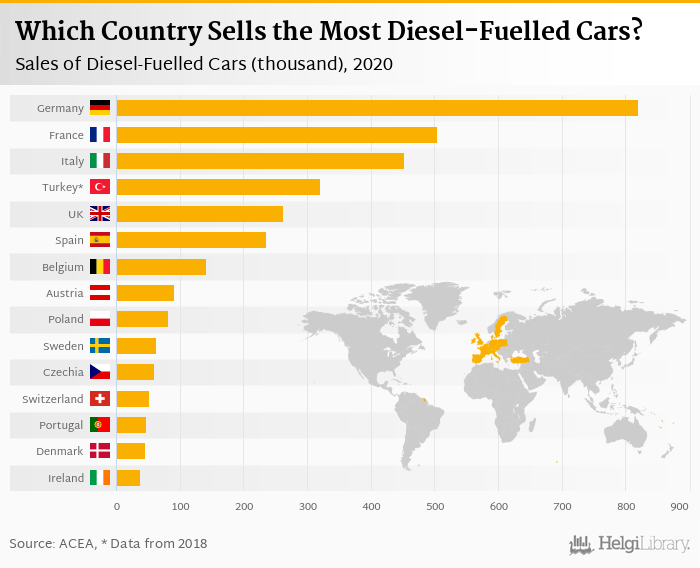
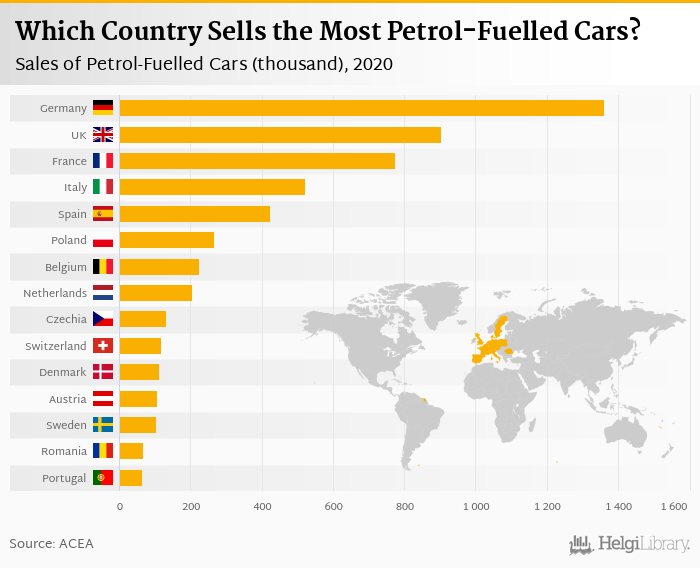
Some 1,210 thousand petrol-powered vehicles were sold, down 34.6% when compared to a year ago. The share decreased to 40.5% of all new passenger cars sold in 4Q2020, down from 55.7% seen in the fourth quarter of 2019. Share of diesel-powered cars fell to 24.1% (from 29.9% in 4Q2019) with 721 thousand cars sold in the fourth quarter of 2020.
As a result, share of traditionally-powered cars amounted to 64.7% of all new passenger cars sold in 4Q2020, down from 85.6% seen in the fourth quarter of 2019.
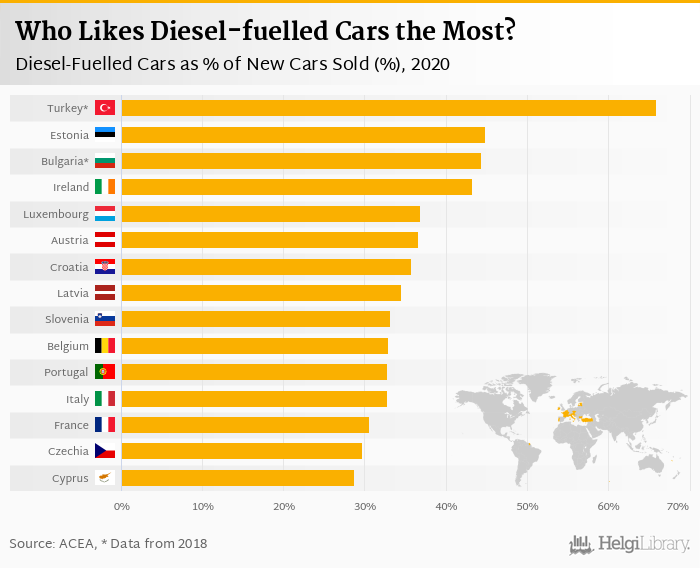
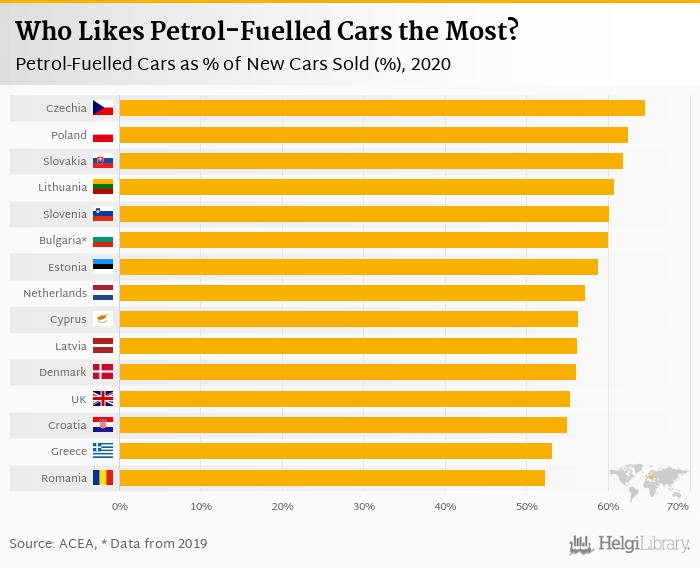
In relative terms, the Czech Republic liked the petrol-fuelled vehicles the most in the fourth quarter of 2020 with 58.6% of all new passenger cars sold followed by Slovakia (57.9%) and Poland (57.3%). On the other hand, diesel-powered cars were preferred most in Estonia (38.2% of all cars sold), followed by Croatia (with 34.9%) and Slovenia (33.8%).
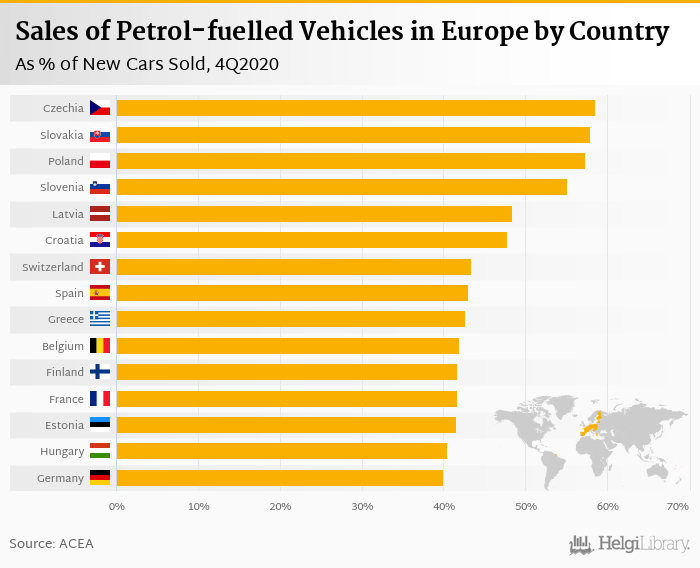
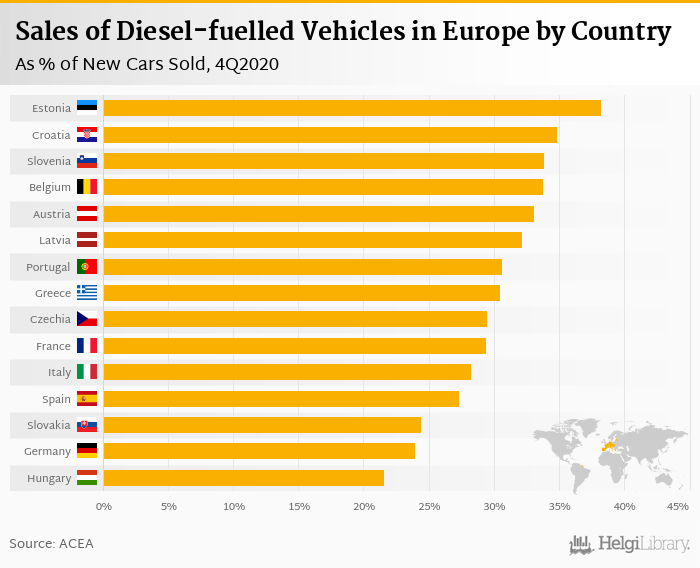
The following charts show where the most cars are sold absolutely and relatively in Europe and elsewhere in the world:
| Country | 1Q2019 | 2Q2019 | 3Q2019 | 4Q2019 | 1Q2020 | 2Q2020 | 3Q2020 | 4Q2020 |
|---|---|---|---|---|---|---|---|---|
| Austria | 3.03 | 2.78 | 2.85 | 2.75 | 3.62 | 3.76 | 5.99 | 10.2 |
| Belgium | 4.20 | 4.12 | 4.06 | 5.35 | 7.69 | 6.36 | 12.4 | 19.9 |
| Bulgaria | 0.112 | 0.055 | 0.053 | 0.017 | ... | ... | ... | ... |
| Croatia | ... | ... | ... | 0.084 | ... | ... | ... | 0.330 |
| Cyprus | 0.005 | 0.007 | 0.006 | 0.005 | 0.004 | 0.007 | 0.011 | 0.020 |
| Czechia | 0.197 | 0.292 | 0.353 | 0.387 | 1.32 | 0.681 | 0.908 | 2.33 |
| Denmark | 2.23 | 2.12 | 2.34 | 2.72 | 4.16 | 4.11 | 10.2 | 14.1 |
| Estonia | 0.021 | 0.033 | 0.028 | 0.015 | 0.065 | 0.070 | 0.118 | 0.172 |
| Finland | 1.81 | 1.59 | 1.74 | 2.73 | 4.56 | 2.73 | 4.93 | 5.20 |
| France | 14.5 | 14.4 | 13.4 | 19.1 | 35.4 | 29.8 | 45.7 | 74.8 |
| Germany | 23.3 | 24.4 | 26.9 | 34.3 | 52.4 | 41.5 | 111 | 190 |
| Greece | 0.097 | 0.143 | 0.102 | 0.138 | 0.159 | 0.208 | 0.515 | 1.25 |
| Hungary | 0.613 | 0.633 | 0.797 | 0.896 | 1.00 | 0.903 | 1.60 | 2.53 |
| Iceland | 0.515 | 0.587 | 0.555 | 0.481 | 1.17 | 0.651 | 1.16 | 1.23 |
| Ireland | 2.05 | 0.736 | 1.43 | 0.569 | 2.69 | 0.373 | 2.90 | 0.553 |
| Italy | 2.27 | 5.28 | 4.22 | 5.41 | 8.35 | 7.39 | 14.2 | 29.9 |
| Latvia | 0.025 | 0.025 | 0.017 | 0.031 | 0.066 | 0.074 | 0.147 | 0.104 |
| Lithuania | 0.044 | 0.031 | 0.046 | 0.042 | 0.087 | 0.074 | 0.167 | 0.125 |
| Luxembourg | ... | ... | ... | 0.575 | 0.790 | 0.712 | 1.49 | 2.17 |
| Netherlands | 10.3 | 9.75 | 13.7 | 32.9 | 12.0 | 8.14 | 19.1 | 49.9 |
| Norway | 23.4 | 20.6 | 17.6 | 18.1 | 22.6 | 18.0 | 27.0 | 38.2 |
| Poland | 0.634 | 0.754 | 0.547 | 0.763 | 1.28 | 1.22 | 2.06 | 3.54 |
| Portugal | 3.05 | 2.94 | 2.72 | 3.97 | 4.78 | 2.64 | 4.73 | 7.55 |
| Romania | 0.213 | 0.243 | 0.543 | 0.507 | 0.271 | 0.328 | 0.807 | 1.44 |
| Slovakia | 0.106 | 0.083 | 0.077 | 0.101 | 0.324 | 0.310 | 0.474 | 0.376 |
| Slovenia | 0.197 | 0.159 | 0.038 | 0.050 | 0.387 | 0.323 | 0.402 | 0.664 |
| Spain | 4.48 | 4.47 | 3.49 | 5.03 | 7.25 | 3.49 | 10.4 | 20.1 |
| Sweden | 9.84 | 9.38 | 8.61 | 12.6 | 18.5 | 14.1 | 24.0 | 37.5 |
| Switzerland | 3.80 | 3.67 | 3.75 | 6.23 | 5.42 | 4.70 | 9.11 | 14.7 |
| UK | 14.6 | 12.5 | 21.0 | 24.7 | 31.9 | 18.5 | 58.4 | 66.2 |
| EU | 124 | 119 | 128 | 178 | 223 | 167 | 363 | 584 |
| Country | 1Q2019 | 2Q2019 | 3Q2019 | 4Q2019 | 1Q2020 | 2Q2020 | 3Q2020 | 4Q2020 |
|---|---|---|---|---|---|---|---|---|
| Austria | 2.26 | 3.73 | 3.81 | 4.55 | 4.41 | 5.11 | 7.21 | 9.29 |
| Belgium | 5.41 | 4.35 | 4.09 | 3.39 | 6.00 | 2.93 | 3.88 | 3.03 |
| Bulgaria | 0.372 | 0.520 | 0.478 | 0.605 | ... | ... | ... | ... |
| Croatia | ... | ... | ... | 0.351 | ... | ... | ... | 0.721 |
| Cyprus | 0.197 | 0.325 | 0.283 | 0.247 | 0.178 | 0.046 | 0.031 | 0.013 |
| Czechia | 1.36 | 2.22 | 1.92 | 2.37 | 2.11 | 2.01 | 3.02 | 3.56 |
| Denmark | 3.06 | 2.21 | 2.04 | 2.55 | 2.32 | 1.69 | 2.60 | 3.05 |
| Estonia | 0.521 | 0.783 | 0.672 | 0.717 | 0.795 | 0.488 | 0.692 | 0.763 |
| Finland | 3.79 | 4.25 | 4.29 | 3.24 | 5.09 | 3.13 | 5.19 | 5.32 |
| France | 23.0 | 27.0 | 25.5 | 31.4 | 30.1 | 30.4 | 49.3 | 59.1 |
| Germany | 40.7 | 45.8 | 50.4 | 57.0 | 63.1 | 46.5 | 96.4 | 121 |
| Greece | 1.16 | 1.68 | 1.90 | 1.87 | 2.59 | 2.12 | 3.25 | 3.79 |
| Hungary | 1.71 | 2.11 | 2.35 | 3.00 | 5.68 | 5.18 | 9.14 | 11.8 |
| Iceland | 0.164 | 0.367 | 0.283 | 0.231 | 0.298 | 0.249 | 0.404 | 0.223 |
| Ireland | 4.93 | 1.86 | 3.18 | 0.215 | 6.34 | 0.276 | 4.07 | 0.308 |
| Italy | 27.3 | 28.3 | 22.8 | 31.5 | 34.7 | 27.6 | 62.8 | 96.7 |
| Latvia | 0.279 | 0.482 | 0.384 | 0.334 | 0.396 | ... | 0.396 | 0.531 |
| Lithuania | 0.528 | 0.926 | 0.772 | 1.11 | 1.08 | 0.825 | 4.20 | 2.18 |
| Luxembourg | ... | ... | ... | 0.594 | 0.853 | 0.698 | 1.10 | 1.37 |
| Netherlands | 6.36 | 7.95 | 7.36 | 7.17 | 11.5 | 6.86 | 13.3 | 14.9 |
| Norway | 3.66 | 5.60 | 4.30 | 3.99 | 3.22 | 2.57 | 2.89 | 3.55 |
| Poland | 6.79 | 10.7 | 10.8 | 13.5 | 13.5 | 9.11 | 16.1 | 22.9 |
| Portugal | 1.93 | 2.74 | 2.05 | 2.70 | 2.83 | 1.50 | 2.94 | 4.64 |
| Romania | 1.45 | 1.46 | 2.41 | 2.15 | 2.25 | 2.27 | 4.08 | 5.67 |
| Slovakia | 0.587 | 1.04 | 1.07 | 1.61 | 1.33 | 1.26 | 2.00 | 2.94 |
| Slovenia | 0.427 | 0.774 | 0.606 | 0.585 | 0.461 | 0.312 | 0.415 | 0.416 |
| Spain | 22.4 | 27.9 | 25.4 | 33.0 | 29.4 | 16.7 | 40.3 | 51.0 |
| Sweden | 4.15 | 6.96 | 6.65 | 7.45 | 5.44 | 4.89 | 8.74 | 9.88 |
| Switzerland | 3.46 | 5.26 | 5.44 | 7.85 | 6.05 | 5.75 | 7.89 | 12.5 |
| UK | 40.7 | 39.5 | 51.0 | 42.8 | 68.2 | 23.3 | 114 | 13.9 |
| EU | 194 | 215 | 220 | 242 | 283 | 182 | 426 | 414 |
| Country | 1Q2019 | 2Q2019 | 3Q2019 | 4Q2019 | 1Q2020 | 2Q2020 | 3Q2020 | 4Q2020 |
|---|---|---|---|---|---|---|---|---|
| Austria | 0.061 | 0.185 | 0.139 | 0.195 | 0.102 | 0.122 | 0.111 | 0.072 |
| Belgium | 0.601 | 1.45 | 0.888 | 0.680 | 0.821 | 0.852 | 1.27 | 0.923 |
| Bulgaria | 0.174 | 0.803 | 0.823 | 0.419 | ... | ... | ... | ... |
| Croatia | ... | ... | ... | 0.048 | ... | ... | ... | 0.324 |
| Czechia | 0.363 | 0.725 | 0.674 | 0.435 | 0.476 | 0.446 | 0.735 | 0.916 |
| Denmark | 0.001 | ... | ... | 0.005 | ... | ... | ... | ... |
| Estonia | 0.012 | 0.216 | 0.307 | 0.173 | 0.276 | 0.149 | 0.198 | 0.185 |
| Finland | 0.072 | 0.555 | 0.737 | 0.778 | 0.735 | 0.400 | 0.487 | 0.218 |
| France | 1.01 | 0.796 | 2.89 | 4.01 | 0.584 | 3.54 | 6.89 | 5.95 |
| Germany | 3.41 | 4.65 | 4.13 | 2.69 | 2.31 | 2.15 | 4.57 | 4.68 |
| Greece | 0.314 | 0.623 | 0.800 | 0.596 | 0.376 | 0.272 | 0.542 | 0.590 |
| Hungary | 0.006 | 0.007 | ... | ... | 0.002 | 0.013 | 0.168 | 0.128 |
| Iceland | 0.003 | 0.021 | 0.017 | 0.013 | 0.015 | 0.006 | 0.013 | 0.001 |
| Italy | 41.5 | 47.1 | 43.6 | 41.9 | 29.4 | 21.4 | 36.3 | 38.0 |
| Latvia | 0.035 | 0.042 | 0.010 | 0.020 | 0.020 | 0.020 | 0.027 | 0.073 |
| Lithuania | ... | ... | 0.002 | ... | ... | ... | 0.022 | 0.051 |
| Luxembourg | ... | ... | ... | 0.001 | 0.003 | ... | ... | ... |
| Netherlands | 0.243 | 0.301 | 0.104 | 0.167 | 0.114 | 0.344 | 0.783 | 0.854 |
| Norway | 0.007 | 0.003 | 0.003 | 0.003 | 0.001 | 0.001 | 0.002 | 0.001 |
| Poland | 2.06 | 2.85 | 2.90 | 0.344 | 0.602 | 1.18 | 2.69 | 4.70 |
| Portugal | 0.563 | 0.731 | 0.646 | 0.212 | 0.106 | 0.349 | 0.475 | 0.915 |
| Romania | 0.304 | 0.295 | 0.742 | 0.074 | 0.093 | 1.07 | 2.87 | 5.25 |
| Slovakia | 0.156 | 0.088 | 0.065 | 0.083 | 0.112 | 0.218 | 0.275 | 0.339 |
| Slovenia | 0.030 | 0.039 | 0.029 | 0.017 | 0.005 | 0.046 | 0.058 | 0.076 |
| Spain | 5.65 | 8.09 | 7.51 | 3.94 | 2.34 | 1.56 | 4.44 | 4.75 |
| Sweden | 0.424 | 1.32 | 2.33 | 2.04 | 1.10 | 0.542 | 0.998 | 0.864 |
| Switzerland | 0.091 | 0.424 | 0.378 | 0.360 | 0.259 | 0.115 | 0.111 | 0.081 |
| EU | 53.9 | 66.3 | 64.2 | 57.6 | 38.2 | 31.6 | 57.0 | 57.9 |
| Country | 1Q2019 | 2Q2019 | 3Q2019 | 4Q2019 | 1Q2020 | 2Q2020 | 3Q2020 | 4Q2020 |
|---|---|---|---|---|---|---|---|---|
| Austria | 31.5 | 36.2 | 23.9 | 27.9 | 21.3 | 21.6 | 18.3 | 22.5 |
| Belgium | 46.1 | 49.6 | 41.1 | 35.8 | 40.5 | 29.0 | 39.4 | 33.1 |
| Bulgaria | 3.94 | 3.99 | 4.03 | 3.75 | ... | ... | ... | ... |
| Croatia | ... | ... | ... | 4.19 | ... | ... | ... | 2.77 |
| Cyprus | 0.992 | 1.25 | 1.11 | 0.911 | 0.901 | 0.610 | 0.761 | 0.619 |
| Czechia | 16.7 | 18.2 | 16.7 | 17.6 | 14.7 | 12.1 | 16.6 | 16.9 |
| Denmark | 17.3 | 14.8 | 13.5 | 14.5 | 13.0 | 9.13 | 10.4 | 12.6 |
| Estonia | 3.21 | 3.25 | 2.70 | 2.16 | 2.51 | 1.55 | 2.23 | 2.12 |
| Finland | 6.56 | 5.75 | 4.53 | 4.04 | 3.95 | 2.95 | 3.21 | 2.68 |
| France | 191 | 209 | 160 | 196 | 121 | 102 | 139 | 142 |
| Germany | 291 | 318 | 277 | 267 | 224 | 159 | 227 | 210 |
| Greece | 7.83 | 8.66 | 8.21 | 5.65 | 5.79 | 4.31 | 5.78 | 6.37 |
| Hungary | 7.45 | 8.44 | 6.67 | 8.50 | 6.95 | 4.83 | 7.67 | 8.17 |
| Iceland | 0.877 | 1.46 | 0.685 | 0.490 | 0.452 | 0.364 | 0.687 | 0.300 |
| Ireland | 30.8 | 7.52 | 14.7 | 1.48 | 21.9 | 1.49 | 13.0 | 1.86 |
| Italy | 236 | 225 | 143 | 159 | 118 | 84.4 | 132 | 117 |
| Latvia | 1.80 | 1.78 | 1.59 | 1.60 | 1.48 | 0.891 | 1.24 | 1.18 |
| Lithuania | 2.10 | 2.04 | 2.24 | 1.91 | 1.49 | 0.946 | 1.77 | 2.75 |
| Luxembourg | ... | ... | ... | 4.85 | 4.60 | 3.34 | 4.80 | 3.89 |
| Netherlands | 10.6 | 8.63 | 7.31 | 6.18 | 5.47 | 2.65 | 3.18 | 1.71 |
| Norway | 5.35 | 6.39 | 5.40 | 5.69 | 3.49 | 3.21 | 3.09 | 2.37 |
| Poland | 29.6 | 27.2 | 25.5 | 28.4 | 19.7 | 13.2 | 22.3 | 25.7 |
| Portugal | 24.4 | 26.5 | 18.5 | 20.1 | 15.7 | 6.33 | 13.6 | 12.2 |
| Romania | 10.9 | 9.79 | 12.1 | 10.5 | 8.30 | 6.19 | 8.39 | 11.0 |
| Slovakia | 6.44 | 6.73 | 5.89 | 6.44 | 4.99 | 3.55 | 5.49 | 5.06 |
| Slovenia | 6.24 | 6.60 | 4.65 | 4.82 | 5.48 | 4.51 | 4.97 | 3.54 |
| Spain | 90.1 | 102 | 73.7 | 85.0 | 59.7 | 36.2 | 70.0 | 70.0 |
| Sweden | 27.0 | 33.4 | 23.8 | 34.7 | 16.4 | 15.6 | 15.4 | 15.3 |
| Switzerland | 20.3 | 22.5 | 16.8 | 19.8 | 13.6 | 10.3 | 13.7 | 14.2 |
| UK | 188 | 152 | 139 | 104 | 91.4 | 27.5 | 90.1 | 52.7 |
| EU | 1,225 | 1,226 | 970 | 992 | 781 | 520 | 802 | 721 |
| Country | 1Q2019 | 2Q2019 | 3Q2019 | 4Q2019 | 1Q2020 | 2Q2020 | 3Q2020 | 4Q2020 |
|---|---|---|---|---|---|---|---|---|
| Austria | 44.0 | 52.1 | 44.8 | 35.7 | 25.2 | 27.5 | 29.0 | 26.0 |
| Belgium | 99.5 | 95.1 | 78.6 | 65.6 | 72.4 | 50.1 | 60.1 | 41.0 |
| Bulgaria | 5.23 | 6.02 | 4.73 | 5.25 | ... | ... | ... | ... |
| Croatia | ... | ... | ... | 7.04 | ... | ... | ... | 3.79 |
| Cyprus | 1.57 | 2.19 | 1.53 | 1.52 | 1.62 | 1.04 | 1.59 | 1.43 |
| Czechia | 41.7 | 48.7 | 43.8 | 39.7 | 33.0 | 30.6 | 34.0 | 33.5 |
| Denmark | 43.7 | 36.9 | 33.6 | 32.2 | 29.3 | 25.0 | 30.6 | 26.3 |
| Estonia | 4.43 | 5.55 | 4.57 | 4.03 | 3.46 | 2.11 | 3.16 | 2.31 |
| Finland | 16.9 | 19.0 | 16.4 | 15.5 | 13.9 | 9.85 | 12.2 | 9.60 |
| France | 324 | 362 | 274 | 322 | 178 | 185 | 210 | 201 |
| Germany | 522 | 576 | 533 | 506 | 359 | 260 | 393 | 350 |
| Greece | 16.9 | 28.2 | 16.2 | 13.1 | 12.5 | 8.27 | 13.4 | 8.93 |
| Hungary | 24.6 | 29.0 | 30.7 | 30.4 | 19.0 | 12.1 | 15.8 | 15.3 |
| Iceland | 1.16 | 2.14 | 1.00 | 0.675 | 0.543 | 0.442 | 0.807 | 0.348 |
| Ireland | 26.3 | 6.51 | 13.8 | 0.898 | 19.1 | 0.953 | 11.7 | 1.09 |
| Italy | 231 | 239 | 172 | 211 | 156 | 95.9 | 137 | 133 |
| Latvia | 2.60 | 3.05 | 2.47 | 2.47 | 2.29 | 1.71 | 2.03 | 1.77 |
| Lithuania | 7.53 | 10.3 | 8.10 | 8.60 | 8.07 | 4.24 | 5.28 | 6.87 |
| Luxembourg | ... | ... | ... | 5.93 | 5.67 | 4.13 | 5.86 | 3.94 |
| Netherlands | 87.9 | 83.7 | 76.5 | 68.1 | 74.1 | 37.1 | 54.0 | 40.5 |
| Norway | 6.06 | 7.17 | 5.14 | 3.99 | 3.08 | 3.09 | 3.18 | 1.96 |
| Poland | 101 | 96.9 | 92.7 | 102 | 72.5 | 47.4 | 72.1 | 76.3 |
| Portugal | 29.5 | 36.3 | 21.5 | 22.8 | 21.9 | 8.75 | 19.1 | 14.5 |
| Romania | 22.9 | 24.0 | 36.6 | 24.3 | 17.1 | 11.8 | 18.8 | 18.4 |
| Slovakia | 16.6 | 20.2 | 17.2 | 16.9 | 12.2 | 9.71 | 13.4 | 12.0 |
| Slovenia | 13.4 | 13.4 | 11.0 | 10.3 | 9.87 | 8.31 | 9.39 | 5.77 |
| Spain | 194 | 233 | 163 | 166 | 120 | 63.2 | 130 | 110 |
| Sweden | 32.5 | 43.0 | 38.5 | 51.5 | 24.7 | 24.4 | 27.8 | 25.9 |
| Switzerland | 44.4 | 53.2 | 42.8 | 51.0 | 30.1 | 26.9 | 29.6 | 31.8 |
| UK | 458 | 365 | 382 | 278 | 292 | 101 | 327 | 184 |
| EU | 2,178 | 2,239 | 1,912 | 1,850 | 1,438 | 931 | 1,495 | 1,210 |

 Helgi Library