Sales of electrically-chargeable vehicles amounted to 228 thousand in 1Q2020, up by 101 thousand in 1Q2020 compared to last year
Electric cars represented 7.47% of all new cars sold in 1Q2020, up from 3.06% a year ago.
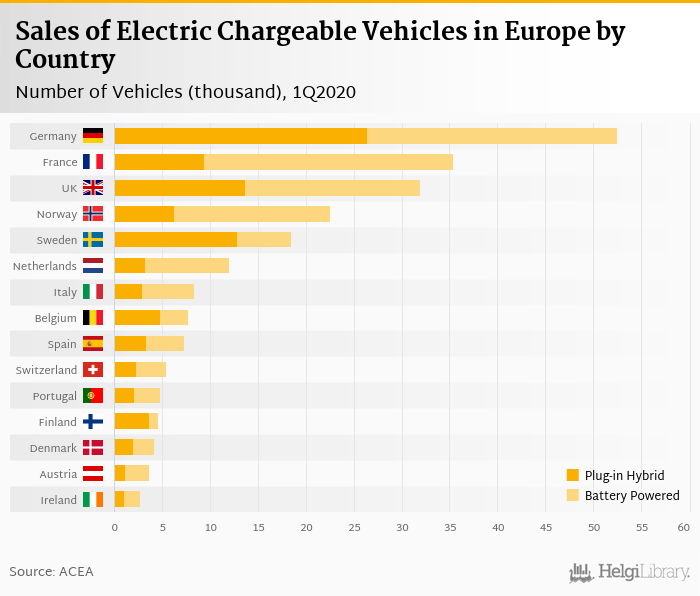
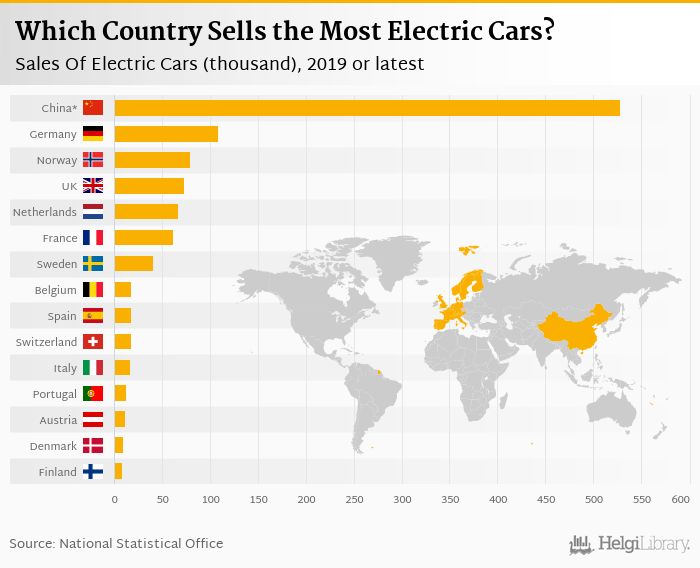
Most electric vehicles have been sold in Germany (52.4 thousand) while France registered the biggest increase in sales when compared to last year.
Sales of new electrically-chargeable passenger cars (battery electric and plug-in hybrid electric vehicles) reached 228 thousand in the first quarter of 2020 in the enlarged Europe (EU plus Iceland, Norway and Switzerland), according to ACEA. This is 79.9% more, or 127 thousand more than in the previous year.
Share of electric chargeable vehicles increased to 7.47% of all new passenger cars sold in 1Q2020, up from 3.06% seen in the first quarter of 2019. Most electric vehicles (52.4 thousand) were sold in Germany (up 125% yoy), followed by France (35.4 thousand, up 144%), the United Kingdom with 31.9 thousand thousand cars (up 119%), 22.6 thousand new vehicles were registered in Norway (down 3.58%) and 18.5 thousand in Sweden (up 88.4%). The five largest countries accounted for 70.5% of total new vehicles registered in the first quarter of 2020:
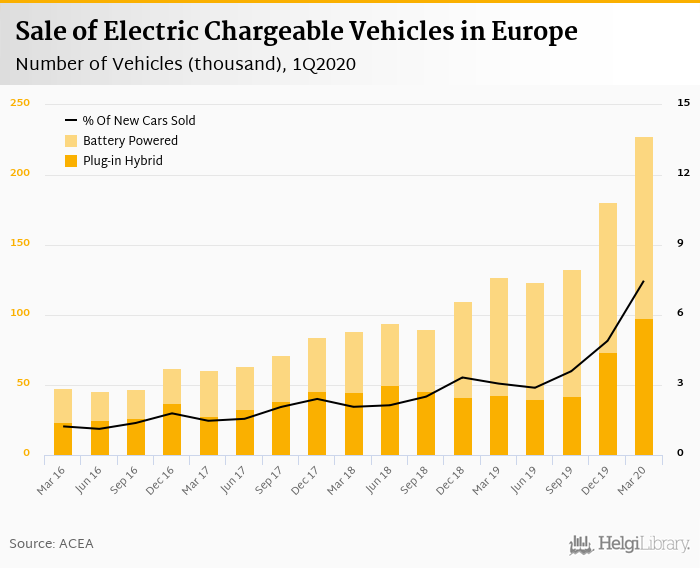
As partly seen above, the sale of battery-electric (BEV) increased by 55.7% when compared to last year, while registration of plug-in hybrid vehicles (PHEV) rose by 127%.
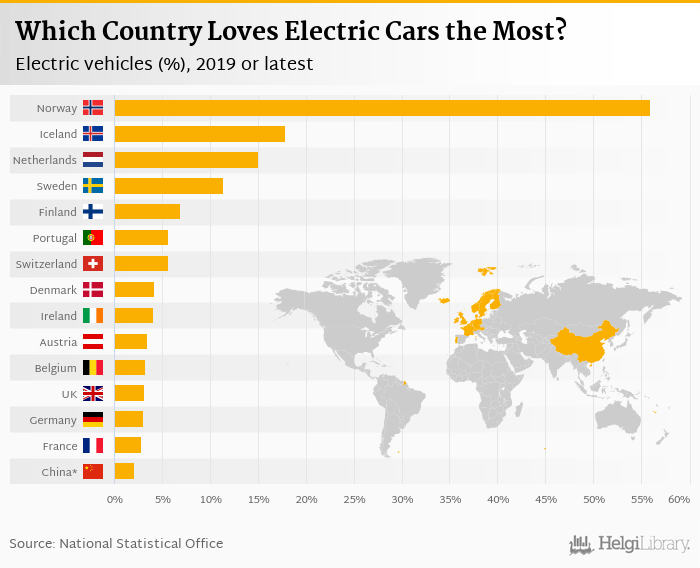
In relative terms, Norway liked the electric chargeable vehicles the most in the first quarter of 2020 with 69.7% of all new passenger cars sold followed by Iceland (47.2%) and Sweden (27.9%). On the other end of the scale was Lithuania with only 0.811%, Greece with 0.743% and Cyprus with just 0.136% of electric cars sold, as % of total:

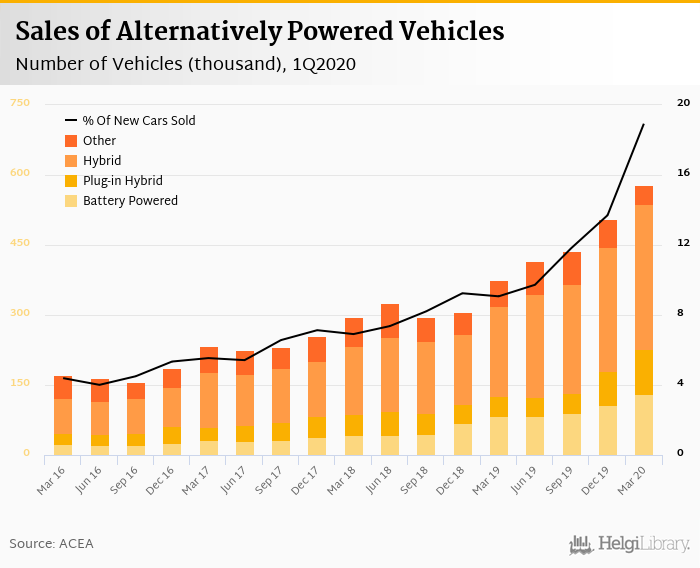
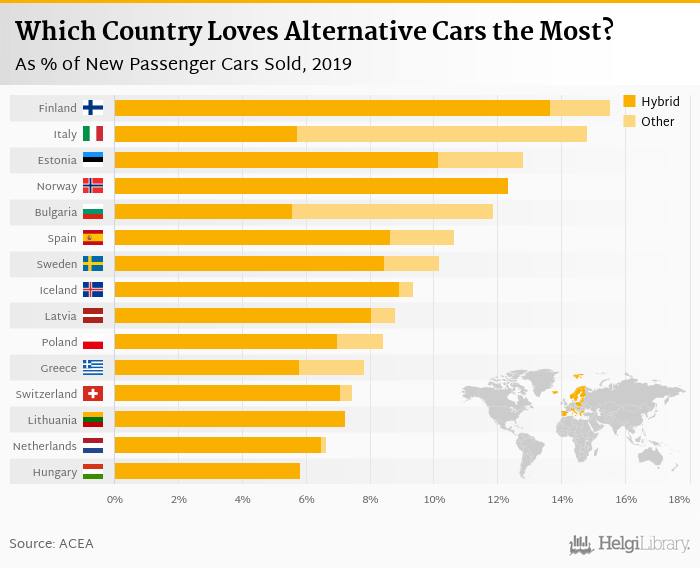
When hybrid electric vehicles (cars that combine a conventional internal combustion engine system with an electric propulsion system) and other alternatively-powered cars (such as natural gas vehicles (NGV), LPG-fueled vehicles and ethanol (E85) vehicles) are included, total sales of alternatively-powered cars (other than using diesel or petrol) amounted to 578 thousand vehicles in the first quarter of 2020. This is 53.8% more, or 202 thousand more than in the previous year.
Together with electric chargeable vehicles, the share of total alternatively-powered vehicles increased to 18.9% of all new passenger cars sold in 1Q2020, up from 9.07% seen in the first quarter of 2019:
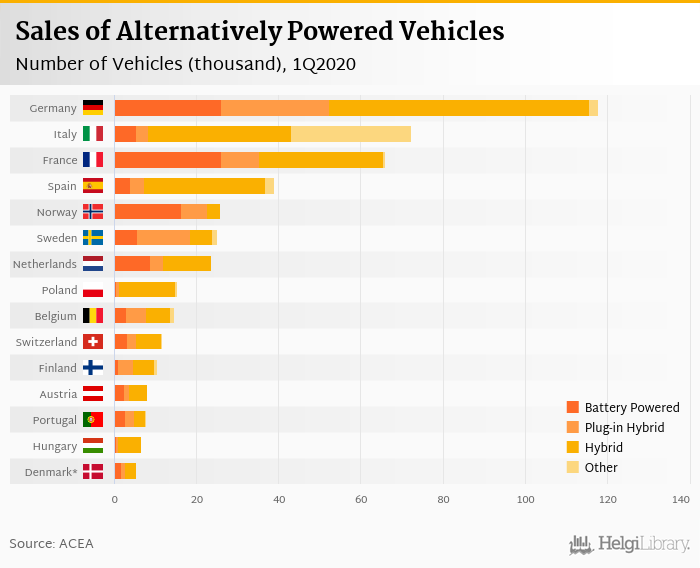
In relative terms, Norway liked the alternatively-powered vehicles the most in the first quarter of 2020 with 79.7% of all new passenger cars sold followed by Iceland (59.9%) and Sweden (37.8%). On the other hand, alternatively-fuelled cars represented only 9.33% of all cars sold in Slovakia, 7.77% in the Czech Republic and 5.96% in Slovenia, according to ACEA.

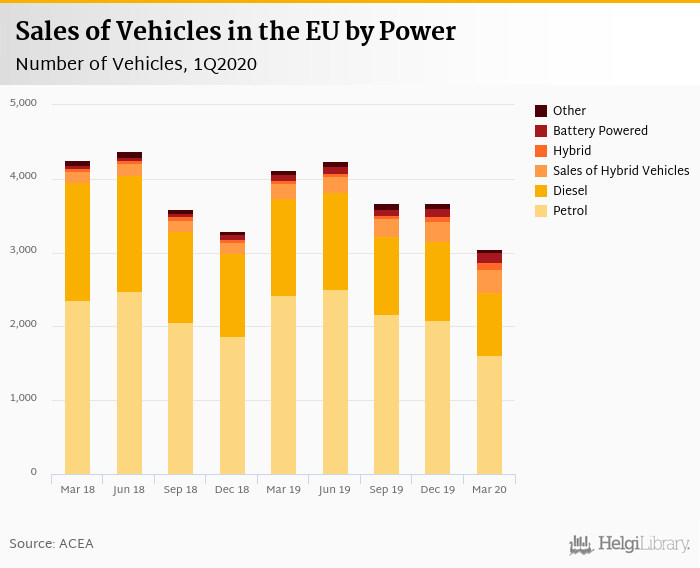
Sales of traditionally-powered vehicles using petrol and diesel reached 2,464 thousand in the first quarter of 2020 in the enlarged Europe, according to ACEA. This is 34.2% less, or 1,280 thousand less than in the previous year.
Some 1,617 thousand petrol-powered vehicles were sold, down 33.4% when compared to a year ago. The share decreased to 52.9% of all new passenger cars sold in 1Q2020, down from 58.6% seen in the first quarter of 2019. Share of diesel-powered cars fell to 27.7% (from 31.8% in 1Q2019) with 847 thousand cars sold in the first quarter of 2020.
As a result, share of traditionally-powered cars amounted to 80.7% of all new passenger cars sold in 1Q2020, down from 90.3% seen in the first quarter of 2019.

In relative terms, Lithuania liked the petrol-fuelled vehicles the most in the first quarter of 2020 with 75.2% of all new passenger cars sold followed by Netherlands (71.5%) and Slovenia (69.0%). On the other hand, diesel-powered cars were preferred most in Estonia (44.4% of all cars sold), followed by Ireland (with 42.7%) and Austria (39.0%).


The following charts show where the most cars are sold absolutely and relatively in Europe and elsewhere in the world:


| Country | 2Q2017 | 3Q2017 | 4Q2017 | 1Q2018 | 2Q2018 | 3Q2018 | 4Q2018 | 1Q2019 | 2Q2019 | 3Q2019 | 4Q2019 | 1Q2020 |
|---|---|---|---|---|---|---|---|---|---|---|---|---|
| Austria | 1.88 | 1.90 | 1.86 | 2.25 | 2.08 | 1.79 | 2.53 | 2.98 | 2.78 | 2.85 | 2.76 | 3.62 |
| Belgium | 4.04 | 3.37 | 3.75 | 3.98 | 3.69 | 2.84 | 2.85 | 4.32 | 4.46 | 3.88 | 5.35 | 7.69 |
| Bulgaria | 0.011 | 0.022 | 0.071 | 0.055 | 0.024 | 0.054 | 0.087 | 0.112 | 0.055 | 0.053 | 0.017 | ... |
| Cyprus | ... | ... | ... | ... | ... | ... | ... | ... | ... | ... | ... | 0.004 |
| Czechia | 0.061 | 0.085 | 0.073 | 0.215 | 0.268 | 0.216 | 0.281 | 0.197 | 0.297 | 0.348 | 0.387 | 1.32 |
| Denmark | 0.165 | 0.366 | 0.731 | 1.05 | 1.14 | 1.40 | 1.10 | 2.23 | 2.12 | 2.34 | 2.72 | 4.16 |
| Estonia | 0.011 | 0.015 | 0.004 | 0.018 | 0.028 | 0.043 | 0.029 | 0.021 | 0.033 | 0.028 | 0.015 | 0.065 |
| Finland | 0.680 | 0.801 | 0.969 | 1.48 | 1.74 | 1.27 | 1.21 | 1.81 | 1.59 | 1.74 | 2.73 | 4.56 |
| France | 9.12 | 8.12 | 10.3 | 10.9 | 10.6 | 9.60 | 14.5 | 14.5 | 14.4 | 13.3 | 19.1 | 35.4 |
| Germany | 12.1 | 14.5 | 17.7 | 17.6 | 16.4 | 16.3 | 17.4 | 23.3 | 24.4 | 26.9 | 34.3 | 52.4 |
| Greece | 0.045 | 0.048 | 0.069 | 0.067 | 0.102 | 0.063 | 0.084 | 0.082 | 0.132 | 0.101 | 0.138 | 0.159 |
| Hungary | 0.277 | 0.270 | 0.461 | 0.481 | 0.538 | 0.438 | 0.613 | 0.613 | 0.633 | 0.797 | 0.896 | 1.00 |
| Iceland | ... | ... | ... | ... | ... | ... | ... | 0.500 | 0.552 | 0.555 | 0.481 | 1.17 |
| Ireland | 0.100 | 0.341 | 0.072 | 0.573 | 0.389 | 0.897 | 0.113 | 2.05 | 0.736 | 1.44 | 0.569 | 2.69 |
| Italy | 1.26 | 1.19 | 1.32 | 1.86 | 2.51 | 2.83 | 2.52 | 2.16 | 5.27 | 4.22 | 5.37 | 8.35 |
| Latvia | 0.020 | 0.011 | 0.011 | 0.021 | 0.033 | 0.017 | 0.022 | 0.025 | 0.025 | 0.021 | 0.031 | 0.066 |
| Lithuania | 0.011 | 0.015 | 0.015 | 0.013 | 0.024 | 0.021 | 0.057 | 0.044 | 0.031 | 0.046 | 0.042 | 0.087 |
| Luxembourg | ... | ... | ... | ... | ... | ... | ... | ... | ... | ... | ... | 0.790 |
| Netherlands | 2.37 | 2.69 | 3.52 | 4.51 | 5.18 | 6.55 | 12.1 | 11.7 | 11.3 | 15.3 | 33.2 | 12.0 |
| Norway | 13.7 | 15.9 | 19.2 | 16.2 | 19.6 | 16.2 | 20.7 | 23.4 | 20.6 | 17.6 | 18.1 | 22.6 |
| Poland | 0.203 | 0.317 | 0.369 | 0.340 | 0.330 | 0.286 | 0.365 | 0.620 | 0.737 | 0.541 | 0.763 | 1.28 |
| Portugal | 0.903 | 0.944 | 1.46 | 1.52 | 2.15 | 1.82 | 2.34 | 3.05 | 2.94 | 2.72 | 3.97 | 4.78 |
| Romania | 0.022 | 0.074 | 0.091 | 0.195 | 0.102 | 0.171 | 0.137 | 0.213 | 0.243 | 0.543 | 0.507 | 0.271 |
| Slovakia | 0.133 | 0.039 | 0.080 | 0.055 | 0.169 | 0.019 | 0.071 | 0.106 | 0.083 | 0.077 | 0.101 | 0.324 |
| Slovenia | 0.112 | 0.115 | 0.155 | 0.170 | 0.190 | 0.144 | 0.159 | 0.153 | 0.159 | 0.109 | 0.230 | 0.387 |
| Spain | 1.48 | 2.12 | 2.87 | 2.20 | 2.82 | 2.44 | 4.35 | 4.48 | 4.47 | 3.49 | 5.03 | 7.25 |
| Sweden | 4.27 | 4.91 | 6.68 | 6.21 | 6.41 | 7.33 | 8.38 | 9.81 | 9.17 | 8.83 | 12.6 | 18.5 |
| Switzerland | 1.83 | 2.08 | 2.82 | 2.25 | 2.23 | 2.01 | 3.03 | 3.81 | 3.67 | 3.75 | 6.25 | 5.42 |
| UK | 10.3 | 13.1 | 11.9 | 14.2 | 15.2 | 15.5 | 15.1 | 14.6 | 12.5 | 21.0 | 24.7 | 31.9 |
| EU | 65.1 | 73.3 | 86.5 | 88.3 | 94.0 | 90.2 | 110 | 127 | 123 | 133 | 180 | 228 |
| Country | 2Q2017 | 3Q2017 | 4Q2017 | 1Q2018 | 2Q2018 | 3Q2018 | 4Q2018 | 1Q2019 | 2Q2019 | 3Q2019 | 4Q2019 | 1Q2020 |
|---|---|---|---|---|---|---|---|---|---|---|---|---|
| Austria | 1.64 | 1.59 | 1.67 | 1.68 | 2.00 | 2.08 | 1.75 | 2.32 | 3.73 | 3.81 | 4.54 | 4.41 |
| Belgium | 3.22 | 2.64 | 2.46 | 4.49 | 4.12 | 3.18 | 3.38 | 5.29 | 4.01 | 4.27 | 3.62 | 6.00 |
| Bulgaria | 0.349 | 0.195 | 0.412 | 0.336 | 0.372 | 0.395 | 0.497 | 0.372 | 0.520 | 0.478 | 0.605 | ... |
| Cyprus | ... | ... | ... | ... | ... | ... | ... | ... | ... | ... | ... | 0.178 |
| Czechia | 0.723 | 0.696 | 0.787 | 0.720 | 0.928 | 1.42 | 1.48 | 1.36 | 2.18 | 1.96 | 2.37 | 2.11 |
| Denmark | 2.35 | 1.99 | 1.51 | 1.75 | 2.24 | 2.09 | 2.13 | 3.28 | 2.21 | 2.04 | 2.55 | 2.32 |
| Estonia | 0.348 | 0.308 | 0.238 | 0.330 | 0.444 | 0.437 | 0.355 | 0.521 | 0.783 | 0.672 | 0.717 | 0.795 |
| Finland | 2.24 | 2.38 | 1.70 | 2.99 | 3.38 | 3.20 | 2.29 | 3.79 | 4.25 | 4.29 | 3.24 | 5.09 |
| France | 15.1 | 15.1 | 20.1 | 21.8 | 23.6 | 20.5 | 25.9 | 23.0 | 27.0 | 25.5 | 31.4 | 30.1 |
| Germany | 13.3 | 14.8 | 15.2 | 19.8 | 24.4 | 27.5 | 27.1 | 40.7 | 45.8 | 50.4 | 57.0 | 63.1 |
| Greece | 0.509 | 0.613 | 0.737 | 0.849 | 0.856 | 0.816 | 1.11 | 1.17 | 1.69 | 1.90 | 1.87 | 2.59 |
| Hungary | 1.01 | 0.828 | 0.994 | 1.12 | 1.44 | 1.58 | 1.50 | 1.71 | 2.11 | 2.35 | 3.00 | 5.68 |
| Iceland | ... | ... | ... | ... | ... | ... | ... | 0.164 | 0.367 | 0.283 | 0.231 | 0.298 |
| Ireland | 0.511 | 1.47 | 0.091 | 3.89 | 0.817 | 2.11 | 0.108 | 4.93 | 1.86 | 3.18 | 0.215 | 6.34 |
| Italy | 17.1 | 13.5 | 17.4 | 20.2 | 21.8 | 18.3 | 21.4 | 27.3 | 28.3 | 22.7 | 31.4 | 34.7 |
| Latvia | 0.070 | 0.081 | 0.124 | 0.084 | 0.083 | 0.263 | 0.242 | 0.279 | 0.482 | 0.384 | 0.323 | 0.396 |
| Lithuania | 0.147 | 0.219 | 0.214 | 0.168 | 0.681 | 0.729 | 0.493 | 0.483 | 0.926 | 0.772 | 1.11 | 1.08 |
| Luxembourg | ... | ... | ... | ... | ... | ... | ... | ... | ... | ... | ... | 0.853 |
| Netherlands | 4.26 | 4.52 | 4.25 | 6.44 | 6.21 | 4.88 | 3.93 | 5.09 | 6.45 | 5.74 | 7.17 | 11.5 |
| Norway | 5.18 | 5.10 | 4.80 | 3.61 | 5.17 | 4.11 | 3.44 | 3.66 | 5.60 | 4.30 | 3.99 | 3.22 |
| Poland | 3.78 | 3.55 | 4.85 | 5.28 | 5.31 | 5.51 | 6.59 | 6.05 | 10.2 | 10.00 | 12.1 | 13.5 |
| Portugal | 1.16 | 1.16 | 1.38 | 1.66 | 2.02 | 1.81 | 1.76 | 1.93 | 2.74 | 2.05 | 2.70 | 2.83 |
| Romania | 0.768 | 0.652 | 0.570 | 0.765 | 0.768 | 1.28 | 1.03 | 1.45 | 1.46 | 2.41 | 2.15 | 2.25 |
| Slovakia | 0.462 | 0.519 | 0.558 | 0.549 | 0.654 | 0.626 | 0.604 | 0.587 | 1.04 | 1.07 | 1.62 | 1.33 |
| Slovenia | 0.259 | 0.263 | 0.286 | 0.405 | 0.340 | 0.400 | 0.314 | 0.431 | 0.627 | 0.538 | 0.406 | 0.461 |
| Spain | 14.2 | 13.6 | 15.0 | 16.6 | 21.0 | 19.1 | 19.1 | 22.4 | 27.9 | 25.4 | 33.0 | 29.4 |
| Sweden | 4.53 | 4.81 | 5.60 | 5.00 | 7.46 | 3.18 | 4.88 | 4.16 | 7.05 | 6.53 | 12.4 | 5.44 |
| Switzerland | 2.30 | 2.13 | 2.21 | 2.07 | 2.78 | 2.87 | 3.55 | 3.45 | 5.26 | 5.45 | 7.84 | 6.05 |
| UK | 15.0 | 22.4 | 13.8 | 22.5 | 20.9 | 26.2 | 15.2 | 26.3 | 27.1 | 45.5 | 38.2 | 68.2 |
| EU | 110 | 115 | 117 | 145 | 160 | 155 | 150 | 192 | 222 | 234 | 266 | 310 |
| Country | 2Q2017 | 3Q2017 | 4Q2017 | 1Q2018 | 2Q2018 | 3Q2018 | 4Q2018 | 1Q2019 | 2Q2019 | 3Q2019 | 4Q2019 | 1Q2020 |
|---|---|---|---|---|---|---|---|---|---|---|---|---|
| Austria | 0.107 | 0.098 | 0.154 | 0.235 | 0.257 | 0.099 | 0.051 | 0.061 | 0.185 | 0.139 | 0.195 | 0.102 |
| Belgium | 0.690 | 0.769 | 0.688 | 1.13 | 1.86 | 0.853 | 0.382 | 0.628 | 1.48 | 0.911 | 0.680 | 0.821 |
| Bulgaria | ... | ... | ... | ... | ... | 0.242 | 0.050 | 0.174 | 0.803 | 0.823 | 0.419 | ... |
| Czechia | 1.04 | 0.965 | 1.05 | 1.00 | 0.926 | 0.482 | 0.342 | 0.363 | 0.725 | 0.674 | 0.435 | 0.476 |
| Denmark | ... | 0.028 | 0.004 | ... | 0.003 | ... | 0.004 | 0.001 | ... | ... | 0.005 | ... |
| Estonia | 0.017 | 0.001 | 0.003 | 0.002 | 0.002 | 0.002 | 0.003 | 0.012 | 0.216 | 0.307 | 0.173 | 0.276 |
| Finland | 0.097 | 0.129 | 0.164 | 0.295 | 0.450 | 0.373 | 0.043 | 0.072 | 0.555 | 0.737 | 0.778 | 0.735 |
| France | 0.300 | 0.357 | 0.871 | 0.687 | 0.967 | 0.589 | 0.800 | 1.01 | 0.796 | 2.89 | 4.01 | 0.584 |
| Germany | 1.63 | 2.06 | 2.89 | 3.97 | 5.74 | 3.68 | 2.08 | 3.41 | 4.65 | 4.13 | 2.69 | 2.31 |
| Greece | 0.043 | 0.088 | 0.145 | 0.272 | 0.343 | 0.215 | 0.200 | 0.314 | 0.623 | 0.800 | 0.596 | 0.376 |
| Hungary | 0.003 | 0.011 | 0.015 | 0.012 | 0.014 | 0.007 | 0.017 | 0.006 | 0.007 | ... | ... | 0.002 |
| Iceland | ... | ... | ... | ... | ... | ... | ... | 0.003 | 0.021 | 0.018 | 0.013 | 0.015 |
| Italy | 42.5 | 33.9 | 39.3 | 46.0 | 49.1 | 33.6 | 33.1 | 41.4 | 47.1 | 43.6 | 41.9 | 29.4 |
| Latvia | 0.019 | 0.020 | 0.018 | 0.010 | 0.021 | 0.010 | 0.018 | 0.035 | 0.042 | 0.038 | 0.020 | 0.020 |
| Luxembourg | ... | ... | ... | ... | ... | ... | ... | ... | ... | ... | ... | 0.003 |
| Netherlands | 0.565 | 0.674 | 0.534 | 0.696 | 0.448 | 0.605 | 0.159 | 0.186 | 0.304 | 0.099 | 0.158 | 0.114 |
| Norway | ... | 0.002 | 0.037 | 0.007 | 0.005 | ... | 0.050 | 0.007 | 0.003 | 0.003 | 0.003 | 0.001 |
| Poland | 2.57 | 2.42 | 2.55 | 2.17 | 2.16 | 1.76 | 1.46 | 2.06 | 2.85 | 2.90 | 0.344 | 0.602 |
| Portugal | 0.355 | 0.482 | 0.534 | 0.593 | 0.527 | 0.248 | 0.541 | 0.563 | 0.731 | 0.646 | 0.212 | 0.106 |
| Romania | ... | ... | ... | 0.177 | 0.348 | 0.566 | 0.268 | 0.304 | 0.295 | 0.742 | 0.074 | 0.093 |
| Slovakia | 0.207 | 0.188 | 0.176 | 0.245 | 0.199 | 0.183 | 0.123 | 0.156 | 0.088 | 0.065 | 0.082 | 0.112 |
| Slovenia | 0.141 | 0.115 | 0.056 | 0.056 | 0.052 | 0.033 | 0.054 | 0.030 | 0.039 | 0.022 | 0.017 | 0.005 |
| Spain | 0.903 | 1.24 | 2.22 | 3.01 | 5.95 | 6.09 | 5.79 | 5.65 | 8.09 | 7.51 | 3.94 | 2.34 |
| Sweden | 0.762 | 1.46 | 1.66 | 1.06 | 1.28 | 1.44 | 0.399 | 0.424 | 1.32 | 2.33 | 2.04 | 1.10 |
| Switzerland | 0.154 | 0.210 | 0.240 | 0.279 | 0.320 | 0.162 | 0.049 | 0.091 | 0.425 | 0.377 | 0.360 | 0.259 |
| EU | 52.1 | 45.3 | 53.3 | 62.0 | 71.0 | 51.2 | 46.0 | 57.0 | 71.3 | 69.8 | 59.1 | 39.8 |
| Country | 2Q2017 | 3Q2017 | 4Q2017 | 1Q2018 | 2Q2018 | 3Q2018 | 4Q2018 | 1Q2019 | 2Q2019 | 3Q2019 | 4Q2019 | 1Q2020 |
|---|---|---|---|---|---|---|---|---|---|---|---|---|
| Austria | ... | ... | ... | 37.9 | 42.1 | 33.9 | 26.2 | 31.5 | 36.2 | 30.7 | 27.9 | 21.3 |
| Belgium | ... | ... | ... | 62.2 | 57.5 | 45.0 | 30.3 | 46.1 | 49.6 | 41.1 | 35.7 | 40.5 |
| Bulgaria | ... | ... | ... | 4.81 | 5.39 | 5.33 | 4.18 | 3.94 | 3.99 | 4.03 | 3.75 | ... |
| Cyprus | ... | ... | ... | ... | ... | ... | ... | ... | ... | ... | ... | 0.901 |
| Czechia | ... | ... | ... | 21.7 | 23.9 | 17.2 | 16.3 | 16.7 | 18.2 | 16.7 | 17.6 | 14.7 |
| Denmark | ... | ... | ... | 20.3 | 21.1 | 15.6 | 15.3 | 17.3 | 14.8 | 13.5 | 14.5 | 13.0 |
| Estonia | ... | ... | ... | 3.15 | 3.61 | 2.77 | 2.60 | 3.21 | 3.25 | 2.70 | 2.16 | 2.51 |
| Finland | ... | ... | ... | 8.48 | 8.24 | 6.21 | 5.78 | 6.56 | 5.75 | 4.53 | 4.04 | 3.95 |
| France | ... | ... | ... | 226 | 253 | 183 | 183 | 191 | 209 | 160 | 196 | 121 |
| Germany | ... | ... | ... | 284 | 307 | 265 | 256 | 291 | 318 | 277 | 267 | 224 |
| Greece | ... | ... | ... | 10.5 | 11.2 | 8.16 | 7.00 | 7.83 | 8.66 | 8.21 | 5.65 | 5.79 |
| Hungary | ... | ... | ... | 7.46 | 9.16 | 8.54 | 7.18 | 7.45 | 8.44 | 6.67 | 8.50 | 6.95 |
| Iceland | ... | ... | ... | ... | ... | ... | ... | 0.879 | 1.46 | 0.685 | 0.490 | 0.452 |
| Ireland | ... | ... | ... | 40.4 | 7.94 | 18.6 | 1.41 | 30.8 | 7.52 | 14.7 | 1.48 | 21.9 |
| Italy | ... | ... | ... | 316 | 285 | 188 | 187 | 236 | 225 | 142 | 159 | 118 |
| Latvia | ... | ... | ... | 1.71 | 1.78 | 1.59 | 1.55 | 1.80 | 1.65 | 1.72 | 1.60 | 1.48 |
| Lithuania | ... | ... | ... | 2.40 | 2.37 | 1.61 | 1.99 | 2.17 | 2.04 | 2.24 | 1.91 | 1.49 |
| Luxembourg | ... | ... | ... | ... | ... | ... | ... | ... | ... | ... | ... | 4.60 |
| Netherlands | ... | ... | ... | 21.1 | 14.9 | 12.7 | 8.51 | 10.7 | 8.77 | 7.36 | 6.33 | 5.47 |
| Norway | ... | ... | ... | 6.29 | 7.29 | 6.41 | 6.27 | 5.35 | 6.39 | 5.40 | 5.69 | 3.49 |
| Poland | ... | ... | ... | 32.4 | 33.5 | 31.8 | 34.2 | 29.6 | 27.3 | 25.6 | 28.5 | 19.7 |
| Portugal | ... | ... | ... | 34.1 | 37.0 | 26.2 | 23.7 | 24.4 | 26.5 | 18.5 | 20.1 | 15.7 |
| Romania | ... | ... | ... | 13.4 | 12.8 | 19.0 | 8.02 | 10.9 | 9.79 | 12.1 | 10.5 | 8.30 |
| Slovakia | ... | ... | ... | 11.4 | 11.5 | 6.32 | 6.62 | 6.44 | 6.73 | 5.89 | 6.44 | 4.99 |
| Slovenia | ... | ... | ... | 6.75 | 6.32 | 5.12 | 4.08 | 5.71 | 5.74 | 4.31 | 4.82 | 5.48 |
| Spain | ... | ... | ... | 131 | 141 | 113 | 88.8 | 90.2 | 101 | 73.7 | 85.0 | 59.7 |
| Sweden | ... | ... | ... | 36.7 | 57.0 | 16.1 | 24.2 | 27.0 | 33.4 | 23.4 | 31.6 | 16.4 |
| Switzerland | ... | ... | ... | 22.7 | 25.5 | 19.8 | 22.1 | 20.3 | 22.5 | 16.8 | 19.8 | 13.6 |
| UK | ... | ... | ... | 241 | 188 | 178 | 143 | 192 | 155 | 141 | 105 | 91.4 |
| EU | ... | ... | ... | 1,603 | 1,575 | 1,235 | 1,115 | 1,316 | 1,317 | 1,060 | 1,071 | 847 |
| Country | 2Q2017 | 3Q2017 | 4Q2017 | 1Q2018 | 2Q2018 | 3Q2018 | 4Q2018 | 1Q2019 | 2Q2019 | 3Q2019 | 4Q2019 | 1Q2020 |
|---|---|---|---|---|---|---|---|---|---|---|---|---|
| Austria | ... | ... | ... | 48.4 | 55.9 | 45.0 | 34.8 | 44.0 | 52.1 | 44.8 | 35.7 | 25.2 |
| Belgium | ... | ... | ... | 93.7 | 98.6 | 72.5 | 57.0 | 99.5 | 95.0 | 78.6 | 65.4 | 72.4 |
| Bulgaria | ... | ... | ... | 4.55 | 5.55 | 5.03 | 3.67 | 5.23 | 6.02 | 4.73 | 5.25 | ... |
| Cyprus | ... | ... | ... | ... | ... | ... | ... | ... | ... | ... | ... | 1.62 |
| Czechia | ... | ... | ... | 44.2 | 49.8 | 45.0 | 36.2 | 41.7 | 48.7 | 43.8 | 39.7 | 33.0 |
| Denmark | ... | ... | ... | 36.5 | 42.3 | 33.3 | 30.0 | 43.5 | 36.9 | 33.6 | 32.2 | 29.3 |
| Estonia | ... | ... | ... | 5.05 | 5.56 | 4.77 | 3.41 | 4.43 | 5.55 | 4.57 | 4.03 | 3.46 |
| Finland | ... | ... | ... | 21.2 | 21.4 | 17.1 | 13.4 | 16.9 | 19.0 | 16.4 | 15.5 | 13.9 |
| France | ... | ... | ... | 297 | 343 | 261 | 287 | 324 | 362 | 274 | 322 | 178 |
| Germany | ... | ... | ... | 553 | 607 | 522 | 460 | 522 | 576 | 533 | 506 | 359 |
| Greece | ... | ... | ... | 15.0 | 23.0 | 12.4 | 10.9 | 16.9 | 28.2 | 16.2 | 13.1 | 12.5 |
| Hungary | ... | ... | ... | 22.5 | 28.0 | 23.3 | 22.7 | 24.6 | 29.0 | 30.7 | 30.4 | 19.0 |
| Iceland | ... | ... | ... | ... | ... | ... | ... | 1.16 | 2.14 | 1.00 | 0.675 | 0.543 |
| Ireland | ... | ... | ... | 26.9 | 6.21 | 14.3 | 0.844 | 26.3 | 6.51 | 13.8 | 0.868 | 19.1 |
| Italy | ... | ... | ... | 190 | 188 | 127 | 174 | 231 | 239 | 172 | 211 | 156 |
| Latvia | ... | ... | ... | 2.44 | 3.05 | 2.47 | 2.14 | 2.60 | 3.30 | 2.84 | 2.47 | 2.29 |
| Lithuania | ... | ... | ... | 3.90 | 6.42 | 6.01 | 5.58 | 7.55 | 10.3 | 8.10 | 8.60 | 8.07 |
| Luxembourg | ... | ... | ... | ... | ... | ... | ... | ... | ... | ... | ... | 5.67 |
| Netherlands | ... | ... | ... | 103 | 91.0 | 81.9 | 59.8 | 88.4 | 84.2 | 77.0 | 68.5 | 74.1 |
| Norway | ... | ... | ... | 7.71 | 10.9 | 7.99 | 6.02 | 6.06 | 7.17 | 5.14 | 3.99 | 3.08 |
| Poland | ... | ... | ... | 99.6 | 91.9 | 91.0 | 85.9 | 101 | 97.4 | 93.4 | 103 | 72.5 |
| Portugal | ... | ... | ... | 25.3 | 29.7 | 18.1 | 17.3 | 29.5 | 36.3 | 21.5 | 22.8 | 21.9 |
| Romania | ... | ... | ... | 14.1 | 17.4 | 25.5 | 14.9 | 22.9 | 24.0 | 36.6 | 24.3 | 17.1 |
| Slovakia | ... | ... | ... | 15.3 | 18.8 | 16.7 | 14.9 | 16.6 | 20.2 | 17.2 | 16.9 | 12.2 |
| Slovenia | ... | ... | ... | 13.0 | 14.4 | 11.1 | 9.78 | 13.4 | 13.4 | 11.5 | 10.3 | 9.87 |
| Spain | ... | ... | ... | 188 | 223 | 167 | 161 | 194 | 233 | 163 | 166 | 120 |
| Sweden | ... | ... | ... | 38.5 | 66.0 | 28.3 | 34.0 | 32.5 | 43.1 | 38.8 | 49.7 | 24.7 |
| Switzerland | ... | ... | ... | 44.8 | 55.0 | 42.6 | 45.7 | 44.4 | 53.2 | 42.8 | 51.0 | 30.1 |
| UK | ... | ... | ... | 441 | 371 | 377 | 283 | 468 | 373 | 386 | 281 | 292 |
| EU | ... | ... | ... | 2,356 | 2,473 | 2,058 | 1,874 | 2,428 | 2,506 | 2,170 | 2,090 | 1,617 |

 Helgi Library