
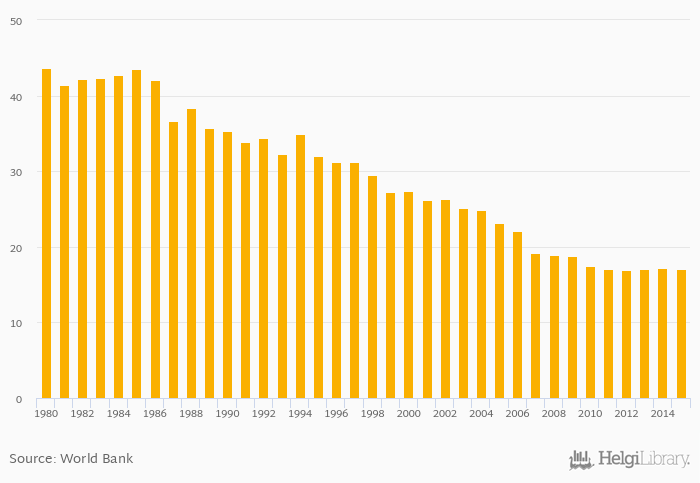
Value added of agriculture as a share of GDP fell 0.798% to 17.1% in Bhutan in 2015, according to Faostat.
Historically, value added of agriculture as a share of GDP in Bhutan reached an all time high of 43.6% in 1980 and an all time low of 17.0% in 2012. When compared to Bhutan's main peers, value added of agriculture as a share of GDP in Bangladesh amounted to 17.0%, 10.0% in China, 18.1% in India and 36.6% in Nepal in 2015.
Bhutan has been ranked 44th within the group of 153 countries we follow in terms of value added of agriculture as a share of GDP, 7 places below the position seen 10 years ago.
| Agriculture, Value Added (As % of GDP) | Unit | 1995 | 1996 | 1997 | 1998 | 1999 | 2000 | 2001 | 2002 | 2003 | 2004 | 2005 | 2006 | 2007 | 2008 | 2009 | 2010 | 2011 | 2012 | 2013 | 2014 | 2015 |
| Bangladesh | % | 17.9% | 17.8% | 17.7% | 17.1% | 16.3% | ||||||||||||||||
| Bhutan | % | 18.7% | 17.5% | 17.1% | 17.0% | 17.1% | ||||||||||||||||
| China | % | 10.3% | 10.1% | 10.0% | 10.1% | 10.0% | ||||||||||||||||
| India | % | 17.7% | 18.2% | 18.4% | 18.0% | 18.0% | ||||||||||||||||
| Japan | % | 1.16% | 1.18% | 1.16% | 1.22% | 1.19% | ||||||||||||||||
| Myanmar | % | ... | ... | ... | ... | ... | ... | ... | ... | ... | ... | ... | ||||||||||
| Nepal | % | 34.0% | 36.5% | 38.3% | 36.5% | 35.1% | ||||||||||||||||
| Pakistan | % | 23.9% | 24.3% | 26.0% | 24.5% | 25.1% | ||||||||||||||||
| Russia | % | 4.69% | 3.87% | 4.37% | 3.93% | 3.95% | ||||||||||||||||
| Sri Lanka | % | 12.7% | 12.8% | 12.1% | 11.0% | 10.8% | ||||||||||||||||
| USA | % | ... | ... | 1.04% | 1.16% | 1.36% | 1.31% | 1.34% |
 Helgi Library


