
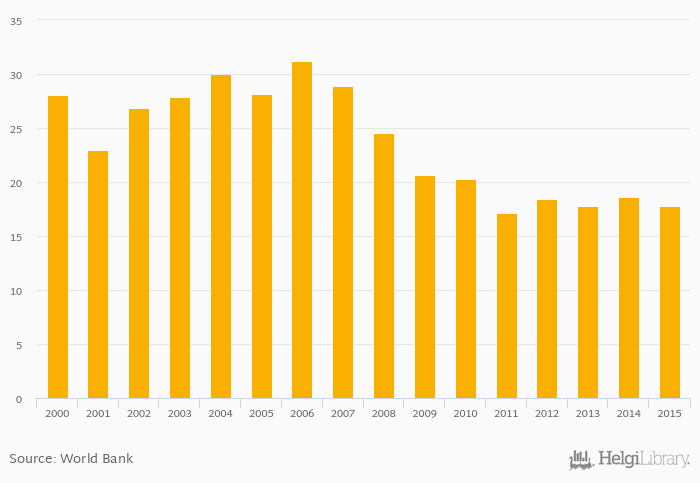
Value added of agriculture as a share of GDP fell 4.54% to 17.8% in East Timor in 2015, according to Faostat.
Historically, value added of agriculture as a share of GDP in East Timor reached an all time high of 31.3% in 2006 and an all time low of 17.1% in 2011.
East Timor has been ranked 43rd within the group of 153 countries we follow in terms of value added of agriculture as a share of GDP, 17 places below the position seen 10 years ago.
| Agriculture, Value Added (As % of GDP) | Unit | 1995 | 1996 | 1997 | 1998 | 1999 | 2000 | 2001 | 2002 | 2003 | 2004 | 2005 | 2006 | 2007 | 2008 | 2009 | 2010 | 2011 | 2012 | 2013 | 2014 | 2015 |
| Australia | % | 2.46% | 2.37% | 2.46% | 2.42% | 2.45% | ||||||||||||||||
| Cambodia | % | 35.7% | 36.0% | 36.7% | 35.6% | 33.5% | ||||||||||||||||
| East Timor | % | ... | ... | ... | ... | ... | 20.7% | 20.3% | 17.1% | 18.4% | 17.8% | |||||||||||
| Indonesia | % | 15.3% | 15.3% | 14.7% | 14.5% | 14.4% | ||||||||||||||||
| Malaysia | % | 9.22% | 10.4% | 11.8% | 10.0% | 9.31% | ||||||||||||||||
| New Zealand | % | 6.28% | 7.18% | 6.73% | 6.96% | 6.84% | ||||||||||||||||
| Papua New Guinea | % | ... | ... | ... | ... | ... | ... | ... | ... | ... | ... | ... | ||||||||||
| Philippines | % | 13.1% | 12.3% | 12.7% | 11.8% | 11.2% | ||||||||||||||||
| Singapore | % | 0.043% | 0.039% | 0.038% | 0.036% | 0.034% | ||||||||||||||||
| Thailand | % | 11.5% | 12.4% | 13.3% | 12.3% | 12.0% | ||||||||||||||||
| Vietnam | % | 19.2% | 18.9% | 20.1% | 19.7% | 18.4% |
 Helgi Library


