
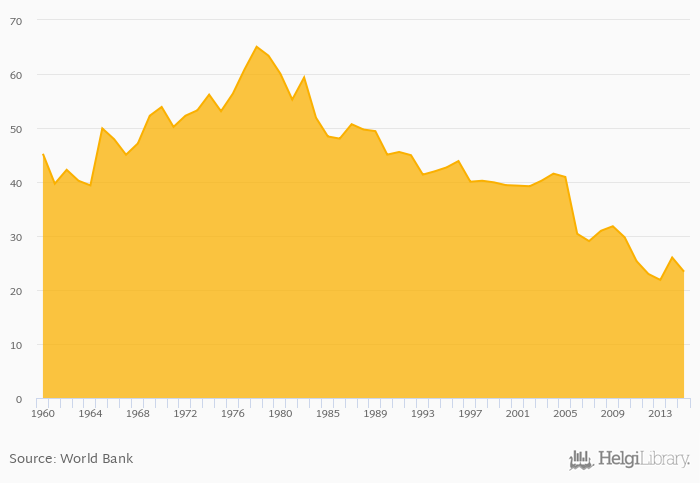
Value added of agriculture as a share of GDP fell 10.1% to 23.4% in Ghana in 2015, according to Faostat.
Historically, value added of agriculture as a share of GDP in Ghana reached an all time high of 65.0% in 1978 and an all time low of 21.9% in 2013. When compared to Ghana's main peers, value added of agriculture as a share of GDP in Benin amounted to 36.5%, 23.8% in Ivory Coast and 30.8% in Togo in 2015.
Ghana has been ranked 28th within the group of 153 countries we follow in terms of value added of agriculture as a share of GDP, 19 places below the position seen 10 years ago.
| Agriculture, Value Added (As % of GDP) | Unit | 1995 | 1996 | 1997 | 1998 | 1999 | 2000 | 2001 | 2002 | 2003 | 2004 | 2005 | 2006 | 2007 | 2008 | 2009 | 2010 | 2011 | 2012 | 2013 | 2014 | 2015 |
| Benin | % | 35.9% | 36.1% | 36.9% | 36.0% | 36.5% | ||||||||||||||||
| Burkina Faso | % | 22.8% | 23.2% | 21.6% | 22.6% | 22.9% | ||||||||||||||||
| Ghana | % | 31.8% | 29.8% | 25.3% | 23.0% | 21.9% | ||||||||||||||||
| Guinea | % | 25.9% | 22.0% | 22.1% | 20.5% | 20.2% | ||||||||||||||||
| Ivory Coast | % | 21.2% | 24.5% | 26.7% | 22.5% | 22.3% | ||||||||||||||||
| Liberia | % | 58.0% | 44.8% | 44.5% | 38.8% | 41.7% | ||||||||||||||||
| Mali | % | 38.9% | 40.6% | 39.3% | 42.3% | 40.8% | ||||||||||||||||
| Niger | % | 39.2% | 40.9% | 38.3% | 39.4% | 37.2% | ||||||||||||||||
| Nigeria | % | 37.1% | 23.9% | 22.3% | 22.1% | 21.0% | ||||||||||||||||
| Togo | % | 32.9% | 31.0% | 30.8% | 30.9% | 30.8% |
 Helgi Library


