
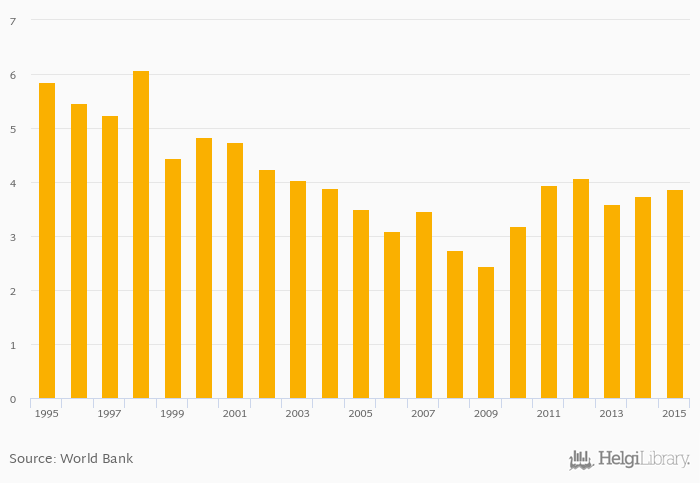
Value added of agriculture as a share of GDP rose 3.57% to 3.87% in Estonia in 2015, according to Faostat.
Historically, value added of agriculture as a share of GDP in Estonia reached an all time high of 6.07% in 1998 and an all time low of 2.44% in 2009.
Estonia has been ranked 108th within the group of 153 countries we follow in terms of value added of agriculture as a share of GDP, 13 places above the position seen 10 years ago.
| Agriculture, Value Added (As % of GDP) | Unit | 1995 | 1996 | 1997 | 1998 | 1999 | 2000 | 2001 | 2002 | 2003 | 2004 | 2005 | 2006 | 2007 | 2008 | 2009 | 2010 | 2011 | 2012 | 2013 | 2014 | 2015 |
| Australia | % | 2.46% | 2.37% | 2.46% | 2.42% | 2.45% | ||||||||||||||||
| Belarus | % | 9.74% | 10.6% | 9.44% | 9.80% | 9.11% | ||||||||||||||||
| China | % | 10.3% | 10.1% | 10.0% | 10.1% | 10.0% | ||||||||||||||||
| Estonia | % | 2.44% | 3.19% | 3.95% | 4.07% | 3.59% | ||||||||||||||||
| Finland | % | 2.54% | 2.73% | 2.73% | 2.64% | 2.68% | ||||||||||||||||
| Germany | % | 0.758% | 0.741% | 0.806% | 0.874% | 0.857% | ||||||||||||||||
| Indonesia | % | 15.3% | 15.3% | 14.7% | 14.5% | 14.4% | ||||||||||||||||
| Japan | % | 1.16% | 1.18% | 1.16% | 1.22% | 1.19% | ||||||||||||||||
| Latvia | % | 3.30% | 4.14% | 3.72% | 3.93% | 3.82% | ||||||||||||||||
| Lithuania | % | 3.34% | 3.46% | 3.40% | 3.43% | 3.42% | ... | |||||||||||||||
| New Zealand | % | 6.28% | 7.18% | 6.73% | 6.96% | 6.84% | ||||||||||||||||
| Papua New Guinea | % | ... | ... | ... | ... | ... | ... | ... | ... | ... | ... | ... | ||||||||||
| Russia | % | 4.69% | 3.87% | 4.37% | 3.93% | 3.95% | ||||||||||||||||
| USA | % | ... | ... | 1.04% | 1.16% | 1.36% | 1.31% | 1.34% |
 Helgi Library


