
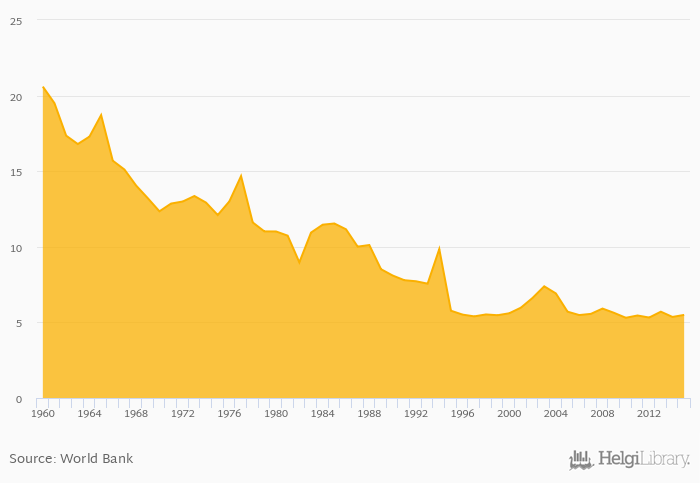
Value added of agriculture as a share of GDP rose 2.51% to 5.49% in Brazil in 2015, according to Faostat.
Historically, value added of agriculture as a share of GDP in Brazil reached an all time high of 20.6% in 1960 and an all time low of 5.30% in 2010.
Brazil has been ranked 97th within the group of 153 countries we follow in terms of value added of agriculture as a share of GDP, 7 places above the position seen 10 years ago.
| Agriculture, Value Added (As % of GDP) | Unit | 1995 | 1996 | 1997 | 1998 | 1999 | 2000 | 2001 | 2002 | 2003 | 2004 | 2005 | 2006 | 2007 | 2008 | 2009 | 2010 | 2011 | 2012 | 2013 | 2014 | 2015 |
| Bolivia | % | 13.8% | 12.9% | 12.5% | 13.0% | 13.3% | ||||||||||||||||
| Brazil | % | 5.63% | 5.30% | 5.46% | 5.32% | 5.71% | ||||||||||||||||
| Chile | % | 3.56% | 3.46% | 3.58% | 3.38% | 3.44% | ||||||||||||||||
| Colombia | % | 7.47% | 7.10% | 6.85% | 6.31% | 6.12% | ||||||||||||||||
| Guyana | % | 24.0% | 21.0% | 21.3% | 21.5% | 21.9% | ||||||||||||||||
| Paraguay | % | 18.9% | 22.5% | 22.3% | 18.1% | 21.6% | ||||||||||||||||
| Peru | % | 7.89% | 7.21% | 7.51% | 7.45% | ... | ... | ... | ||||||||||||||
| Trinidad and Tobago | % | 0.622% | 0.652% | 0.550% | 0.617% | 0.616% | ||||||||||||||||
| Venezuela | % | 6.13% | 5.79% | 5.96% | 5.88% | 5.92% |
 Helgi Library


