
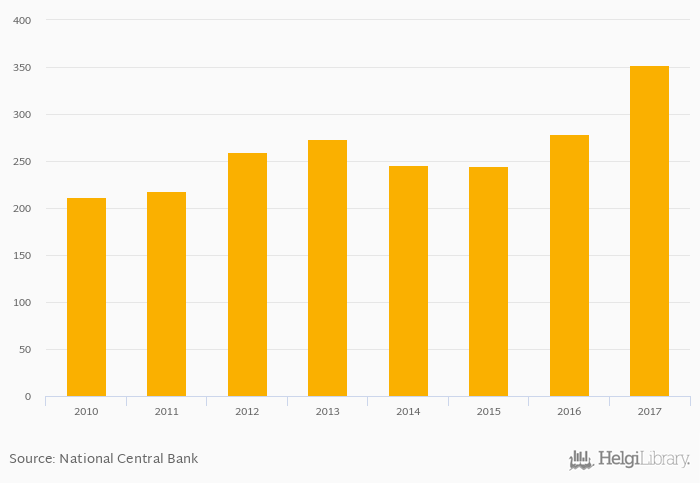
Bank deposits per capita rose 25.9% to USD 352 in Comoros in 2017, according to the National Central Bank.
Historically, bank deposits per capita in Comoros reached an all time high of USD 352 in 2017 and an all time low of USD 212 in 2010.
Comoros has been ranked 85th within the group of 100 countries we follow in terms of bank deposits per capita, 85 places below the position seen 10 years ago.
| Bank Deposits Per Capita (USD) | Unit | 2001 | 2002 | 2003 | 2004 | 2005 | 2006 | 2007 | 2008 | 2009 | 2010 | 2011 | 2012 | 2013 | 2014 | 2015 | 2016 | 2017 | 2018 | 2019 | 2020 | 2021 |
| Comoros | USD | ... | ... | ... | ... | ... | ... | ... | ... | ... | 245 | 279 | 352 | 308 | 318 | ... | ||||||
| Ethiopia | USD | ... | ... | ... | ... | 182 | ... | 183 | 216 | 228 | ... | |||||||||||
| Kenya | USD | 541 | 562 | 592 | 620 | 657 | ||||||||||||||||
| Madagascar | USD | ... | ... | ... | ... | 71.4 | 78.1 | 92.6 | 83.0 | 88.1 | ||||||||||||
| Malawi | USD | ... | ... | ... | ... | 61.3 | 63.7 | 75.5 | 81.3 | 85.2 | ... | |||||||||||
| Mozambique | USD | ... | ... | ... | ... | 249 | 178 | 222 | 230 | 248 | ||||||||||||
| Somalia | USD | ... | ... | ... | ... | ... | ... | ... | ... | ... | ... | ... | ... | ... | ... | ... | ... | ... | ... | ... | ... | ... |
| South Africa | USD | 3,814 | 4,442 | 5,080 | 2,781 | 3,017 | ... | |||||||||||||||
| Swaziland | USD | ... | ... | ... | ... | 717 | 925 | 1,061 | 960 | 990 | ... | ... | ||||||||||
| Tanzania | USD | ... | ... | ... | ... | 176 | 160 | 162 | 155 | ... | ... | ... | ||||||||||
| Uganda | USD | ... | ... | ... | ... | 110 | 110 | 117 | 127 | 145 | ||||||||||||
| Zambia | USD | ... | ... | ... | 367 | 280 | 313 | 288 | 266 |
 Helgi Library


