
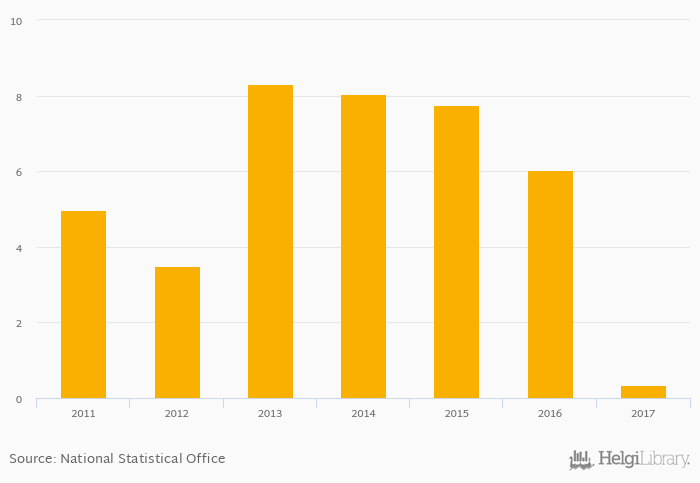
Nominal bank loans growth fell 94.2% to 0.350% in United Arab Emirates in 2017, according to the National Central Bank.
Historically, nominal bank loans growth in United Arab Emirates reached an all time high of 8.30% in 2013 and an all time low of 0.350% in 2017.
United Arab Emirates has been ranked 84th within the group of 100 countries we follow in terms of nominal bank loans growth, 84 places below the position seen 10 years ago.
| Bank Loans Growth (Nominal) | Unit | 2001 | 2002 | 2003 | 2004 | 2005 | 2006 | 2007 | 2008 | 2009 | 2010 | 2011 | 2012 | 2013 | 2014 | 2015 | 2016 | 2017 | 2018 | 2019 | 2020 | 2021 |
| Bahrain | % | 7.78% | 5.58% | ... | ... | ... | ... | ... | ||||||||||||||
| Iran | % | ... | ... | ... | ... | 17.8% | 29.9% | ... | ... | ... | ... | ... | ||||||||||
| Iraq | % | ... | ... | ... | ... | ... | ... | ... | ... | ... | ... | ... | ... | ... | ... | ... | ... | ... | ... | ... | ... | ... |
| Jordan | % | ... | ... | ... | ... | ... | ... | ... | ... | ... | ... | ... | ... | ... | 4.77% | 9.38% | 93.9% | 3.79% | ... | ... | ... | |
| Kuwait | % | ... | ... | ... | ... | ... | ... | ... | ... | ... | ... | ... | ... | 4.22% | -0.656% | 4.23% | 3.93% | 24.5% | ... | |||
| Oman | % | ... | ... | ... | ... | ... | ... | ... | ... | ... | ... | ... | ... | ... | ... | ... | ... | ... | ... | ... | ... | ... |
| Qatar | % | ... | ... | ... | ... | ... | ... | ... | ... | ... | ... | ... | ... | ... | ... | ... | ... | ... | ... | ... | ... | ... |
| Saudi Arabia | % | ... | ... | ... | ... | ... | ... | ... | ... | ... | ... | ... | ... | 9.21% | 2.45% | 3.18% | 4.05% | 8.03% | ||||
| United Arab Emirates | % | ... | ... | ... | ... | ... | ... | ... | ... | ... | ... | 7.76% | 6.04% | 0.350% | 4.81% | 6.18% | ||||||
| Yemen | % | ... | ... | ... | ... | ... | ... | ... | ... | ... | ... | ... | ... | ... | ... | ... | ... | ... | ... | ... | ... | ... |
 Helgi Library


