
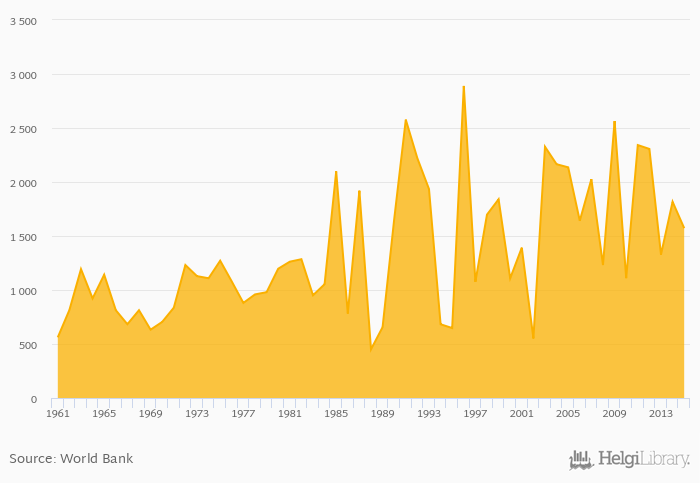
Cereal production fell 13.5% to 1,572 kt in Tunisia in 2015, according to Faostat.
Historically, cereal production in Tunisia reached an all time high of 2,889 kt in 1996 and an all time low of 450 kt in 1988.
Tunisia has been ranked 93rd within the group of 164 countries we follow in terms of cereal production, 15 places below the position seen 10 years ago.
| Cereal Production | Unit | 1995 | 1996 | 1997 | 1998 | 1999 | 2000 | 2001 | 2002 | 2003 | 2004 | 2005 | 2006 | 2007 | 2008 | 2009 | 2010 | 2011 | 2012 | 2013 | 2014 | 2015 |
| Algeria | kt | 5,253 | 4,002 | 3,728 | 5,137 | 4,914 | ||||||||||||||||
| Austria | kt | 5,156 | 5,338 | 6,015 | 5,161 | 4,858 | ||||||||||||||||
| Chad | kt | 2,088 | 2,150 | 1,553 | 3,162 | 2,561 | ||||||||||||||||
| Egypt | kt | 22,757 | 19,451 | 22,015 | 23,756 | 22,305 | ||||||||||||||||
| France | kt | 70,028 | 65,629 | 63,954 | 70,982 | 67,518 | ||||||||||||||||
| Greece | kt | 4,820 | 4,102 | 4,675 | 4,288 | 4,552 | ||||||||||||||||
| Italy | kt | 17,706 | 18,503 | 19,521 | 19,039 | 18,084 | ||||||||||||||||
| Libya | kt | 215 | 217 | 275 | 307 | 306 | ||||||||||||||||
| Malta | kt | 16.1 | 15.2 | 16.6 | 18.2 | 17.1 | ... | |||||||||||||||
| Morocco | kt | 10,444 | 7,834 | 8,689 | 5,311 | 9,874 | ||||||||||||||||
| Slovenia | kt | 536 | 572 | 611 | 580 | 461 | ||||||||||||||||
| Spain | kt | 17,839 | 19,827 | 22,040 | 16,981 | 25,232 | ||||||||||||||||
| Switzerland | kt | 1,006 | 924 | 973 | 923 | 839 | ||||||||||||||||
| Tunisia | kt | 2,564 | 1,109 | 2,342 | 2,306 | 1,328 | ||||||||||||||||
| Turkey | kt | 33,570 | 32,765 | 35,195 | 33,372 | 37,475 |
 Helgi Library


