
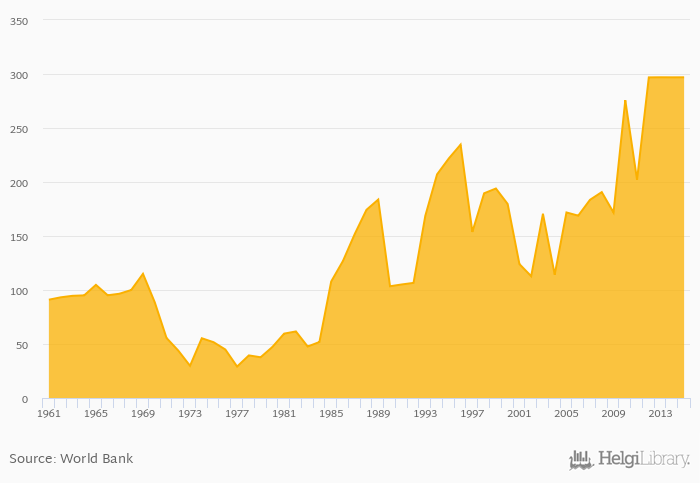
Cereal production rose 0.008% to 297 kt in Mauritania in 2015, according to Faostat.
Historically, cereal production in Mauritania reached an all time high of 297 kt in 2013 and an all time low of 29.1 kt in 1977. When compared to Mauritania's main peers, cereal production in Algeria amounted to 4,970 kt, 5,971 kt in Mali, 8,733 kt in Morocco and 1,405 kt in Senegal in 2015.
Mauritania has been ranked 126th within the group of 164 countries we follow in terms of cereal production, 8 places above the position seen 10 years ago.
| Cereal Production | Unit | 1995 | 1996 | 1997 | 1998 | 1999 | 2000 | 2001 | 2002 | 2003 | 2004 | 2005 | 2006 | 2007 | 2008 | 2009 | 2010 | 2011 | 2012 | 2013 | 2014 | 2015 |
| Algeria | kt | 5,253 | 4,002 | 3,728 | 5,137 | 4,914 | ||||||||||||||||
| Burkina Faso | kt | 3,627 | 4,561 | 3,666 | 4,899 | 4,870 | ||||||||||||||||
| Gambia | kt | 311 | 364 | 183 | 224 | 228 | ||||||||||||||||
| Guinea | kt | 2,631 | 2,743 | 2,947 | 3,240 | 3,409 | ||||||||||||||||
| Libya | kt | 215 | 217 | 275 | 307 | 306 | ||||||||||||||||
| Mali | kt | 6,335 | 6,410 | 5,778 | 6,675 | 5,736 | ||||||||||||||||
| Mauritania | kt | 172 | 276 | 202 | 297 | 297 | ||||||||||||||||
| Morocco | kt | 10,444 | 7,834 | 8,689 | 5,311 | 9,874 | ||||||||||||||||
| Niger | kt | 3,451 | 5,203 | 3,762 | 5,319 | 4,347 | ||||||||||||||||
| Senegal | kt | 1,872 | 1,769 | 1,101 | 1,665 | 1,319 | ||||||||||||||||
| Spain | kt | 17,839 | 19,827 | 22,040 | 16,981 | 25,232 | ||||||||||||||||
| Tunisia | kt | 2,564 | 1,109 | 2,342 | 2,306 | 1,328 |
 Helgi Library


