
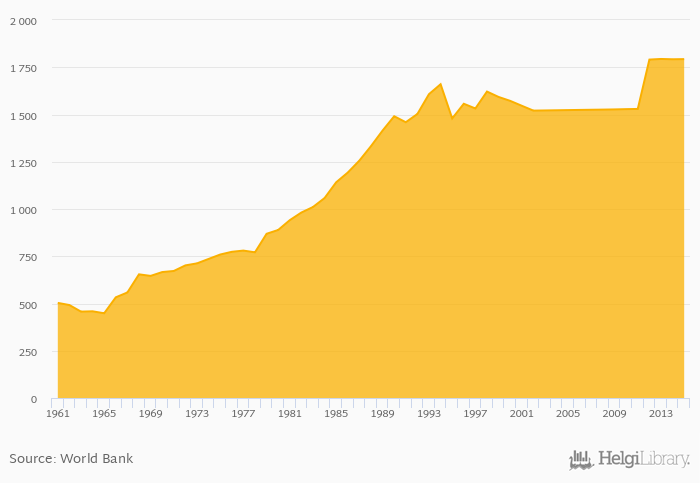
Cereal production rose 0.046% to 1,793 kt in Dem. Republic of the Congo in 2015, according to Faostat.
Historically, cereal production in Dem. Republic of the Congo reached an all time high of 1,794 kt in 2013 and an all time low of 448 kt in 1965. When compared to Dem. Republic of the Congo's main peers, cereal production in Angola amounted to 1,384 kt, 265 kt in Central African Republic, 31.0 kt in Congo and 2,976 kt in Zambia in 2015.
Dem. Republic of the Congo has been ranked 88th within the group of 164 countries we follow in terms of cereal production.
| Cereal Production | Unit | 1995 | 1996 | 1997 | 1998 | 1999 | 2000 | 2001 | 2002 | 2003 | 2004 | 2005 | 2006 | 2007 | 2008 | 2009 | 2010 | 2011 | 2012 | 2013 | 2014 | 2015 |
| Angola | kt | 1,057 | 1,182 | 1,413 | 510 | 1,675 | ||||||||||||||||
| Botswana | kt | 54.4 | 50.3 | 79.1 | 52.8 | 43.8 | ||||||||||||||||
| Cameroon | kt | 2,906 | 3,012 | 2,988 | 3,133 | 3,089 | ||||||||||||||||
| Central African Republic | kt | 251 | 249 | 259 | 261 | 266 | ||||||||||||||||
| Chad | kt | 2,088 | 2,150 | 1,553 | 3,162 | 2,561 | ||||||||||||||||
| Congo | kt | 23.9 | 25.0 | 27.1 | 29.0 | 31.7 | ||||||||||||||||
| Dem. Republic of the Congo | kt | 1,527 | 1,528 | 1,529 | 1,790 | 1,794 | ||||||||||||||||
| Gabon | kt | 41.4 | 43.0 | 45.2 | 45.7 | 46.7 | ||||||||||||||||
| Namibia | kt | 112 | 137 | 117 | 166 | 87.0 | ||||||||||||||||
| Sudan | kt | 5,552 | 3,562 | 5,598 | 2,660 | 5,947 | ||||||||||||||||
| Tanzania | kt | 5,807 | 8,643 | 7,955 | 8,120 | 8,867 | ||||||||||||||||
| Zambia | kt | 2,200 | 3,101 | 3,374 | 3,203 | 2,900 | ||||||||||||||||
| Zimbabwe | kt | 883 | 1,405 | 1,699 | 1,160 | 998 |
 Helgi Library


