
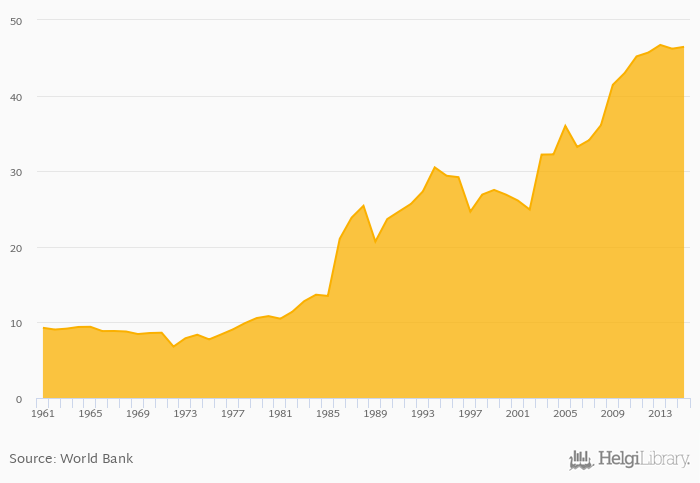
Cereal production rose 0.541% to 46.5 kt in Gabon in 2015, according to Faostat.
Historically, cereal production in Gabon reached an all time high of 46.7 kt in 2013 and an all time low of 6.80 kt in 1972.
Gabon has been ranked 147th within the group of 164 countries we follow in terms of cereal production, 1 place above the position seen 10 years ago.
| Cereal Production | Unit | 1995 | 1996 | 1997 | 1998 | 1999 | 2000 | 2001 | 2002 | 2003 | 2004 | 2005 | 2006 | 2007 | 2008 | 2009 | 2010 | 2011 | 2012 | 2013 | 2014 | 2015 |
| Angola | kt | 1,057 | 1,182 | 1,413 | 510 | 1,675 | ||||||||||||||||
| Botswana | kt | 54.4 | 50.3 | 79.1 | 52.8 | 43.8 | ||||||||||||||||
| Cameroon | kt | 2,906 | 3,012 | 2,988 | 3,133 | 3,089 | ||||||||||||||||
| Central African Republic | kt | 251 | 249 | 259 | 261 | 266 | ||||||||||||||||
| Chad | kt | 2,088 | 2,150 | 1,553 | 3,162 | 2,561 | ||||||||||||||||
| Congo | kt | 23.9 | 25.0 | 27.1 | 29.0 | 31.7 | ||||||||||||||||
| Dem. Republic of the Congo | kt | 1,527 | 1,528 | 1,529 | 1,790 | 1,794 | ||||||||||||||||
| Equatorial Guinea | kt | ... | ... | ... | ... | ... | ... | ... | ... | ... | ... | ... | ... | ... | ... | ... | ... | ... | ... | ... | ... | ... |
| Gabon | kt | 41.4 | 43.0 | 45.2 | 45.7 | 46.7 | ||||||||||||||||
| Namibia | kt | 112 | 137 | 117 | 166 | 87.0 | ||||||||||||||||
| Nigeria | kt | 21,268 | 24,656 | 20,703 | 21,436 | 26,970 | ||||||||||||||||
| Zambia | kt | 2,200 | 3,101 | 3,374 | 3,203 | 2,900 |
 Helgi Library


