
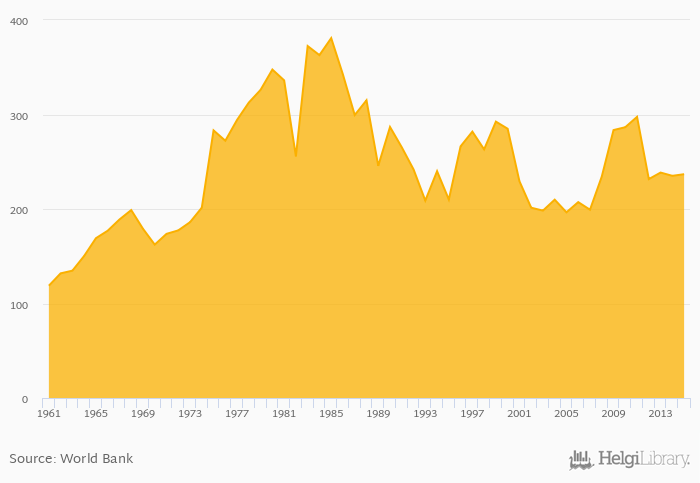
Cereal production rose 0.735% to 237 kt in Costa Rica in 2015, according to Faostat.
Historically, cereal production in Costa Rica reached an all time high of 381 kt in 1985 and an all time low of 119 kt in 1961. When compared to Costa Rica's main peers, cereal production in Guatemala amounted to 1,807 kt, 670 kt in Honduras, 1,004 kt in Nicaragua and 411 kt in Panama in 2015.
Costa Rica has been ranked 133rd within the group of 164 countries we follow in terms of cereal production, 2 places below the position seen 10 years ago.
| Cereal Production | Unit | 1995 | 1996 | 1997 | 1998 | 1999 | 2000 | 2001 | 2002 | 2003 | 2004 | 2005 | 2006 | 2007 | 2008 | 2009 | 2010 | 2011 | 2012 | 2013 | 2014 | 2015 |
| Belize | kt | 75.0 | 89.7 | 91.8 | 91.6 | 112 | ||||||||||||||||
| Colombia | kt | 4,765 | 3,540 | 3,803 | 3,890 | 3,898 | ||||||||||||||||
| Costa Rica | kt | 284 | 287 | 297 | 232 | 239 | ||||||||||||||||
| El Salvador | kt | 990 | 969 | 924 | 1,091 | 1,044 | ||||||||||||||||
| Guatemala | kt | 1,761 | 1,716 | 1,753 | 1,800 | 1,809 | ||||||||||||||||
| Honduras | kt | 702 | 633 | 636 | 622 | 687 | ||||||||||||||||
| Mexico | kt | 31,282 | 34,922 | 28,406 | 33,615 | 33,210 | ||||||||||||||||
| Nicaragua | kt | 914 | 970 | 1,009 | 983 | 1,012 | ||||||||||||||||
| Panama | kt | 331 | 339 | 351 | 370 | 424 | ||||||||||||||||
| USA | kt | 419,380 | 401,670 | 386,816 | 356,933 | 436,554 |
 Helgi Library


