
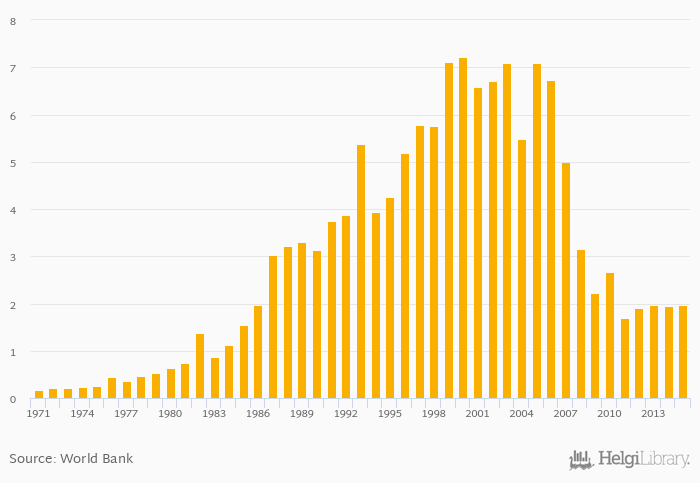
Cereal production rose 0.863% to 1.96 kt in Qatar in 2015, according to Faostat.
Historically, cereal production in Qatar reached an all time high of 7.22 kt in 2000 and an all time low of 0.161 kt in 1971.
Qatar has been ranked 158th within the group of 164 countries we follow in terms of cereal production, 3 places below the position seen 10 years ago.
| Cereal Production | Unit | 1995 | 1996 | 1997 | 1998 | 1999 | 2000 | 2001 | 2002 | 2003 | 2004 | 2005 | 2006 | 2007 | 2008 | 2009 | 2010 | 2011 | 2012 | 2013 | 2014 | 2015 |
| Bahrain | kt | ... | ... | ... | ... | ... | ... | ... | ... | ... | ... | ... | ... | ... | ... | ... | ... | ... | ... | ... | ... | ... |
| Iran | kt | 20,836 | 22,247 | 20,696 | 22,010 | 22,650 | ||||||||||||||||
| Iraq | kt | 2,650 | 4,362 | 4,270 | 4,791 | 6,501 | ||||||||||||||||
| Jordan | kt | 60.9 | 87.3 | 83.0 | 84.0 | 103 | ||||||||||||||||
| Kuwait | kt | 14.2 | 21.4 | 21.4 | 22.5 | 23.8 | ||||||||||||||||
| Oman | kt | 47.0 | 31.7 | 42.5 | 46.3 | 48.0 | ||||||||||||||||
| Pakistan | kt | 38,157 | 34,812 | 36,224 | 33,728 | 36,450 | ||||||||||||||||
| Qatar | kt | 2.22 | 2.67 | 1.70 | 1.91 | 1.98 | ||||||||||||||||
| Saudi Arabia | kt | 1,586 | 1,565 | 1,414 | 1,150 | 973 | ||||||||||||||||
| Turkmenistan | kt | 3,090 | 3,235 | 1,558 | 1,458 | 1,614 | ||||||||||||||||
| United Arab Emirates | kt | 92.7 | 130 | 133 | 134 | 139 | ||||||||||||||||
| Yemen | kt | 674 | 1,013 | 817 | 910 | 863 |
 Helgi Library


