
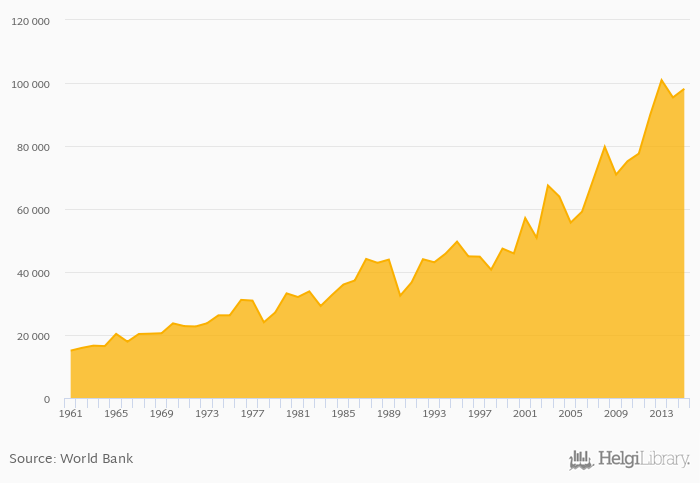
Cereal production rose 2.88% to 98,153 kt in Brazil in 2015, according to Faostat.
Historically, cereal production in Brazil reached an all time high of 100,902 kt in 2013 and an all time low of 15,036 kt in 1961. When compared to Brazil's main peers, cereal production in Bolivia amounted to 2,213 kt, 5,242 kt in Peru and 3,480 kt in Venezuela in 2015.
Brazil has been ranked 4th within the group of 164 countries we follow in terms of cereal production, 3 places above the position seen 10 years ago.
| Cereal Production | Unit | 1995 | 1996 | 1997 | 1998 | 1999 | 2000 | 2001 | 2002 | 2003 | 2004 | 2005 | 2006 | 2007 | 2008 | 2009 | 2010 | 2011 | 2012 | 2013 | 2014 | 2015 |
| Bolivia | kt | 2,379 | 2,134 | 1,988 | 2,160 | 2,230 | ||||||||||||||||
| Brazil | kt | 70,914 | 75,161 | 77,586 | 89,908 | 100,902 | ||||||||||||||||
| Chile | kt | 3,105 | 3,588 | 3,950 | 3,465 | 4,004 | ||||||||||||||||
| Colombia | kt | 4,765 | 3,540 | 3,803 | 3,890 | 3,898 | ||||||||||||||||
| Guyana | kt | 559 | 561 | 623 | 653 | 828 | ||||||||||||||||
| Paraguay | kt | 3,166 | 4,976 | 5,368 | 5,161 | 6,272 | ||||||||||||||||
| Peru | kt | 5,050 | 4,868 | 4,619 | 5,224 | 5,249 | ||||||||||||||||
| Trinidad and Tobago | kt | 5.23 | 5.45 | 6.10 | 5.62 | 6.36 | ||||||||||||||||
| Venezuela | kt | 3,604 | 2,995 | 3,010 | 2,957 | 3,654 |
 Helgi Library


