
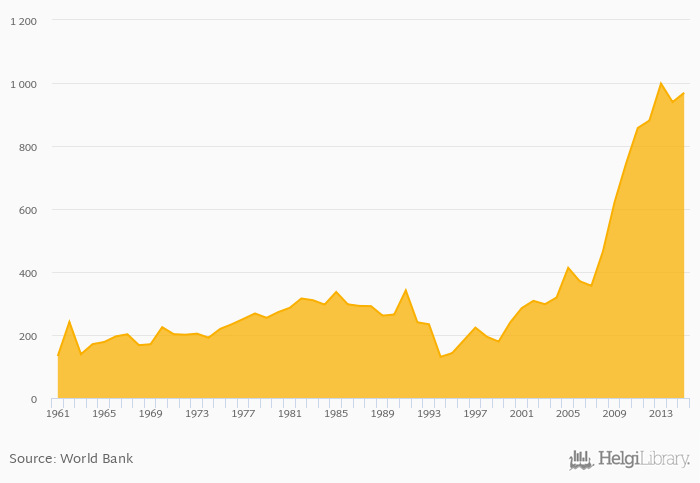
Cereal production rose 3.13% to 969 kt in Rwanda in 2015, according to Faostat.
Historically, cereal production in Rwanda reached an all time high of 998 kt in 2013 and an all time low of 131 kt in 1994. When compared to Rwanda's main peers, cereal production in Burundi amounted to 255 kt, 8,680 kt in Tanzania, 3,518 kt in Uganda and 1,793 kt in Dem. Republic of the Congo in 2015.
Rwanda has been ranked 108th within the group of 164 countries we follow in terms of cereal production, 11 places above the position seen 10 years ago.
| Cereal Production | Unit | 1995 | 1996 | 1997 | 1998 | 1999 | 2000 | 2001 | 2002 | 2003 | 2004 | 2005 | 2006 | 2007 | 2008 | 2009 | 2010 | 2011 | 2012 | 2013 | 2014 | 2015 |
| Angola | kt | 1,057 | 1,182 | 1,413 | 510 | 1,675 | ||||||||||||||||
| Burundi | kt | 311 | 324 | 339 | 257 | 255 | ||||||||||||||||
| Central African Republic | kt | 251 | 249 | 259 | 261 | 266 | ||||||||||||||||
| Congo | kt | 23.9 | 25.0 | 27.1 | 29.0 | 31.7 | ||||||||||||||||
| Dem. Republic of the Congo | kt | 1,527 | 1,528 | 1,529 | 1,790 | 1,794 | ||||||||||||||||
| Kenya | kt | 2,899 | 4,347 | 4,058 | 4,483 | 4,307 | ||||||||||||||||
| Mozambique | kt | 2,239 | 2,803 | 2,932 | 1,631 | 2,239 | ||||||||||||||||
| Rwanda | kt | 622 | 746 | 857 | 881 | 998 | ||||||||||||||||
| South Sudan | kt | ... | ... | ... | ... | ... | ... | ... | ... | ... | ... | ... | ... | ... | ... | ... | ... | ... | ... | ... | ... | |
| Tanzania | kt | 5,807 | 8,643 | 7,955 | 8,120 | 8,867 | ||||||||||||||||
| Uganda | kt | 3,204 | 3,270 | 3,536 | 3,546 | 3,509 | ||||||||||||||||
| Zambia | kt | 2,200 | 3,101 | 3,374 | 3,203 | 2,900 |
 Helgi Library


