
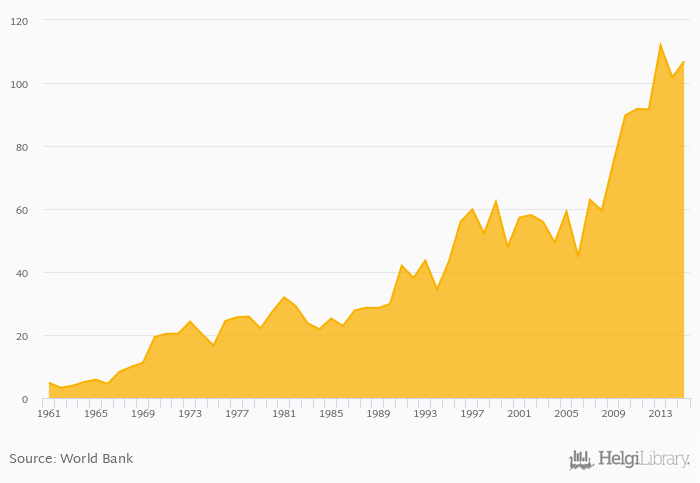
Cereal production rose 4.99% to 107 kt in Belize in 2015, according to Faostat.
Historically, cereal production in Belize reached an all time high of 112 kt in 2013 and an all time low of 3.25 kt in 1962. When compared to Belize's main peers, cereal production in Guatemala amounted to 1,807 kt, 670 kt in Honduras, 33,311 kt in Mexico and 416,648 kt in USA in 2015.
Belize has been ranked 140th within the group of 164 countries we follow in terms of cereal production, 6 places above the position seen 10 years ago.
| Cereal Production | Unit | 1995 | 1996 | 1997 | 1998 | 1999 | 2000 | 2001 | 2002 | 2003 | 2004 | 2005 | 2006 | 2007 | 2008 | 2009 | 2010 | 2011 | 2012 | 2013 | 2014 | 2015 |
| Belize | kt | 75.0 | 89.7 | 91.8 | 91.6 | 112 | ||||||||||||||||
| Canada | kt | 49,552 | 45,651 | 47,271 | 51,781 | 66,372 | ||||||||||||||||
| China | kt | 481,563 | 496,891 | 518,832 | 541,441 | 552,876 | ||||||||||||||||
| El Salvador | kt | 990 | 969 | 924 | 1,091 | 1,044 | ||||||||||||||||
| Guatemala | kt | 1,761 | 1,716 | 1,753 | 1,800 | 1,809 | ||||||||||||||||
| Honduras | kt | 702 | 633 | 636 | 622 | 687 | ||||||||||||||||
| Japan | kt | 11,461 | 11,367 | 11,450 | 11,729 | 11,787 | ||||||||||||||||
| Mexico | kt | 31,282 | 34,922 | 28,406 | 33,615 | 33,210 | ||||||||||||||||
| Nicaragua | kt | 914 | 970 | 1,009 | 983 | 1,012 | ||||||||||||||||
| USA | kt | 419,380 | 401,670 | 386,816 | 356,933 | 436,554 |
 Helgi Library


