
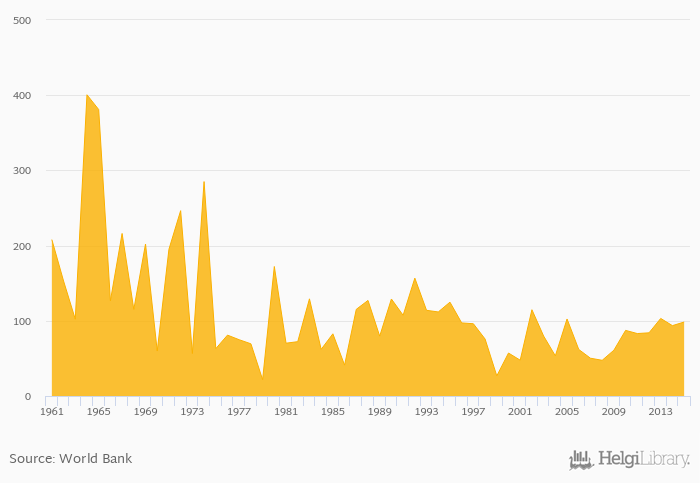
Cereal production rose 5.11% to 98.4 kt in Jordan in 2015, according to Faostat.
Historically, cereal production in Jordan reached an all time high of 401 kt in 1964 and an all time low of 21.7 kt in 1979. When compared to Jordan's main peers, cereal production in Iraq amounted to 6,073 kt, 314 kt in Israel, 1,017 kt in Saudi Arabia and 4,305 kt in Syria in 2015.
Jordan has been ranked 142nd within the group of 164 countries we follow in terms of cereal production, 1 place below the position seen 10 years ago.
| Cereal Production | Unit | 1995 | 1996 | 1997 | 1998 | 1999 | 2000 | 2001 | 2002 | 2003 | 2004 | 2005 | 2006 | 2007 | 2008 | 2009 | 2010 | 2011 | 2012 | 2013 | 2014 | 2015 |
| Egypt | kt | 22,757 | 19,451 | 22,015 | 23,756 | 22,305 | ||||||||||||||||
| Iran | kt | 20,836 | 22,247 | 20,696 | 22,010 | 22,650 | ||||||||||||||||
| Iraq | kt | 2,650 | 4,362 | 4,270 | 4,791 | 6,501 | ||||||||||||||||
| Israel | kt | 257 | 241 | 254 | 323 | 310 | ||||||||||||||||
| Jordan | kt | 60.9 | 87.3 | 83.0 | 84.0 | 103 | ||||||||||||||||
| Kuwait | kt | 14.2 | 21.4 | 21.4 | 22.5 | 23.8 | ||||||||||||||||
| Lebanon | kt | 147 | 112 | 159 | 189 | 179 | ||||||||||||||||
| Saudi Arabia | kt | 1,586 | 1,565 | 1,414 | 1,150 | 973 | ||||||||||||||||
| Syria | kt | 4,739 | 3,901 | 4,828 | 4,599 | 4,206 | ||||||||||||||||
| Turkey | kt | 33,570 | 32,765 | 35,195 | 33,372 | 37,475 | ||||||||||||||||
| United Arab Emirates | kt | 92.7 | 130 | 133 | 134 | 139 | ||||||||||||||||
| Yemen | kt | 674 | 1,013 | 817 | 910 | 863 |
 Helgi Library


