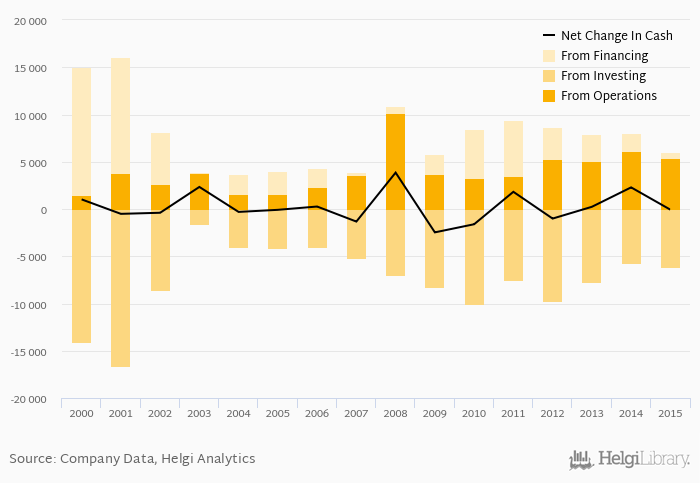
Ceske Drahy's operating cash flow stood at CZK 5,351 mil in 2015, down 13.4% when compared to the previous year. Historically, between 2000 - 2015, the firm’s operating cash flow reached a high of CZK 10,187 mil in 2008 and a low of CZK 1,461 mil in 2000.
Ceske Drahy's total investments stood at CZK -6,090 mil and accounted for of sales in 2015. This is compared to an average of
Severity: Warning
Message: Division by zero
Filename: models/Chunks_model.php
Line Number: 420
Cash from financing amounted to CZK 669 mil, so the company generated CZK -70.5 mil net cash in 2015.
At the end of 2015, the company had a net debt of CZK 33,219 mil, or 5.18x of EBITDA and 0.917 of equity. Net working capital amounted to CZK -1,499 mil, or -4.53% of sales. The cash conversion cycle stood at -68.6 days in 2015. This is an improvement compared to the previous year (-88.7 days), so Ceske Drahy’s working capital was tied up for 20.1 fewer days.
You can see all the company’s data at Ceske Drahy profile, or you can download a report on the company in the report section.
 Helgi Library