
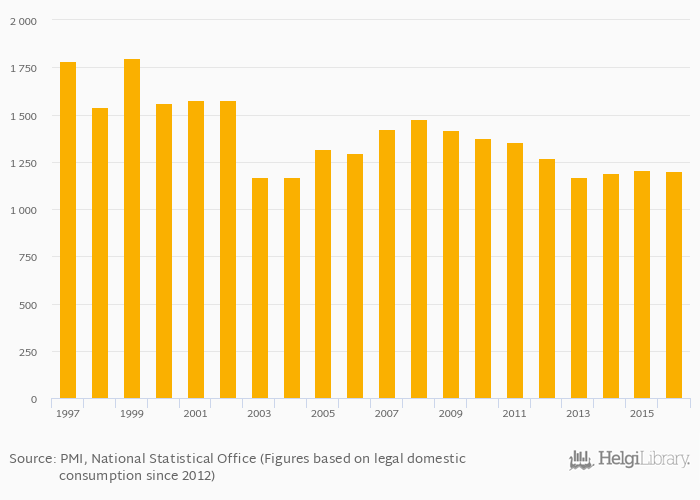
Cigarette consumption per capita fell 0.724% to 1,199 per year in Slovakia in 2016, according to the National Statistical Office.
Historically, cigarette consumption per capita in Slovakia reached an all time high of 1,801 per year in 1999 and an all time low of 1,169 per year in 2004. When compared to Slovakia's main peers, cigarette consumption per capita in Austria amounted to 1,446 per year, 1,316 per year in Czech Republic, 686 per year in Hungary and 915 per year in Poland in 2016.
Slovakia has been ranked 8th within the group of 30 countries we follow in terms of cigarette consumption per capita, 10 places above the position seen 10 years ago.
| Cigarette Consumption Per Capita | Unit | 1996 | 1997 | 1998 | 1999 | 2000 | 2001 | 2002 | 2003 | 2004 | 2005 | 2006 | 2007 | 2008 | 2009 | 2010 | 2011 | 2012 | 2013 | 2014 | 2015 | 2016 |
| Austria | per year | 1,612 | 1,554 | 1,498 | 1,453 | 1,477 | ||||||||||||||||
| Czechia | per year | 1,996 | 1,987 | 1,390 | 1,189 | 1,285 | ||||||||||||||||
| Germany | per year | 1,011 | 1,020 | 993 | 949 | 959 | ||||||||||||||||
| Hungary | per year | ... | 1,416 | 1,396 | 985 | 831 | 669 | |||||||||||||||
| Italy | per year | ... | 1,436 | 1,405 | 1,308 | 1,205 | 1,206 | |||||||||||||||
| Poland | per year | 1,501 | 1,456 | 1,070 | 979 | 897 | ||||||||||||||||
| Russia | per year | ... | ... | ... | ... | ... | ... | ... | ... | ... | ... | ... | ... | ... | ... | ... | ... | ... | ... | ... | ... | ... |
| Slovakia | per year | ... | 1,377 | 1,354 | 1,269 | 1,171 | 1,191 | |||||||||||||||
| Switzerland | per year | ... | ... | ... | ... | ... | ... | ... | ... | ... | ... | ... | ... | ... | ... | ... | ... | ... | 1,270 | 1,190 | ||
| Ukraine | per year | ... | ... | ... | ... | ... | ... | ... | ... | ... | ... | ... | ... | ... | ... | ... | ... | ... | ... | ... | ... | ... |
 Helgi Library


