
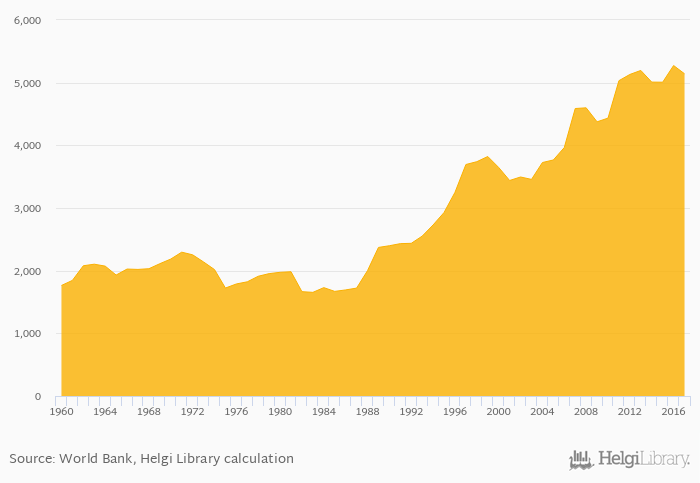
CO2 emissions per capita fell 2.50% to 5,142 kg in Chile in 2017, according to World Bank / EIA.
Historically, CO2 emissions per capita in Chile reached an all time high of 5,274 kg in 2016 and an all time low of 1,654 kg in 1983.
Chile has been ranked 48th within the group of 79 countries we follow in terms of CO2 emissions per capita, 17 places above the position seen 10 years ago.
| CO2 Emissions Per Capita | Unit | 1997 | 1998 | 1999 | 2000 | 2001 | 2002 | 2003 | 2004 | 2005 | 2006 | 2007 | 2008 | 2009 | 2010 | 2011 | 2012 | 2013 | 2014 | 2015 | 2016 | 2017 |
| Argentina | kg | 4,159 | 4,286 | 4,424 | 4,426 | 4,479 | ||||||||||||||||
| Bolivia | kg | 1,566 | 1,795 | 1,781 | 1,894 | ... | ... | ... | ||||||||||||||
| Brazil | kg | 2,168 | 2,270 | 2,453 | 2,552 | 2,466 | ||||||||||||||||
| Chile | kg | 5,032 | 5,131 | 5,195 | 5,009 | 5,008 | ||||||||||||||||
| Paraguay | kg | 810 | 792 | 803 | 830 | ... | ... | ... | ||||||||||||||
| Peru | kg | 1,423 | 1,446 | 1,478 | 1,501 | 1,564 | ||||||||||||||||
| Uruguay | kg | 2,297 | 2,567 | 2,237 | 1,986 | ... | ... | ... |
 Helgi Library


