
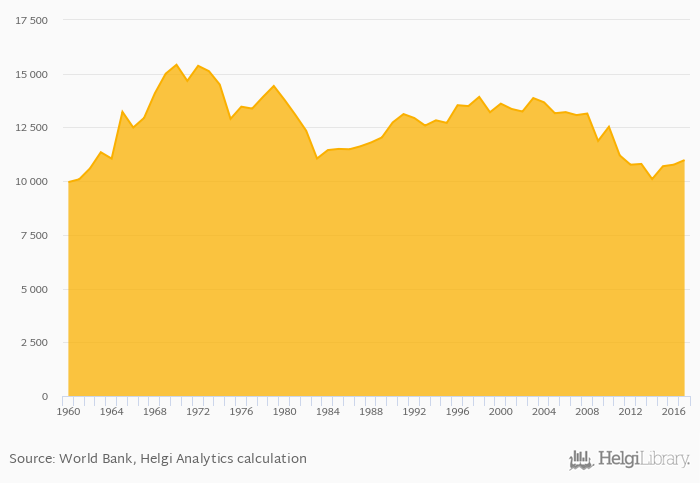
CO2 emissions per capita rose 1.99% to 10,980 kg in Belgium in 2017, according to World Bank / EIA.
Historically, CO2 emissions per capita in Belgium reached an all time high of 15,418 kg in 1970 and an all time low of 9,956 kg in 1960. When compared to Belgium's main peers, CO2 emissions per capita in France amounted to 4,938 kg, 9,389 kg in Germany, 18,431 kg in Luxembourg and 12,502 kg in Netherlands in 2017.
Belgium has been ranked 19th within the group of 79 countries we follow in terms of CO2 emissions per capita, 3 places below the position seen 10 years ago.
| CO2 Emissions Per Capita | Unit | 1997 | 1998 | 1999 | 2000 | 2001 | 2002 | 2003 | 2004 | 2005 | 2006 | 2007 | 2008 | 2009 | 2010 | 2011 | 2012 | 2013 | 2014 | 2015 | 2016 | 2017 |
| Austria | kg | 7,738 | 7,414 | 7,424 | 6,938 | 7,204 | ||||||||||||||||
| Belgium | kg | 11,199 | 10,764 | 10,801 | 10,097 | 10,695 | ||||||||||||||||
| Denmark | kg | 8,364 | 7,333 | 7,758 | 7,147 | 6,560 | ||||||||||||||||
| France | kg | 5,288 | 5,293 | 5,273 | 4,732 | 4,795 | ||||||||||||||||
| Germany | kg | 9,189 | 9,328 | 9,647 | 9,117 | 9,195 | ||||||||||||||||
| Italy | kg | 6,593 | 6,414 | 5,773 | 5,360 | 5,589 | ||||||||||||||||
| Luxembourg | kg | 22,460 | 21,564 | 20,279 | 19,228 | 18,380 | ||||||||||||||||
| Netherlands | kg | 13,486 | 12,971 | 12,630 | 11,952 | 12,407 | ||||||||||||||||
| Poland | kg | 8,460 | 8,069 | 8,153 | 7,724 | 7,738 | ||||||||||||||||
| Spain | kg | 6,635 | 6,572 | 5,893 | 5,836 | 6,175 | ||||||||||||||||
| United Kingdom | kg | 7,925 | 8,156 | 7,910 | 7,220 | 6,878 |
 Helgi Library


