
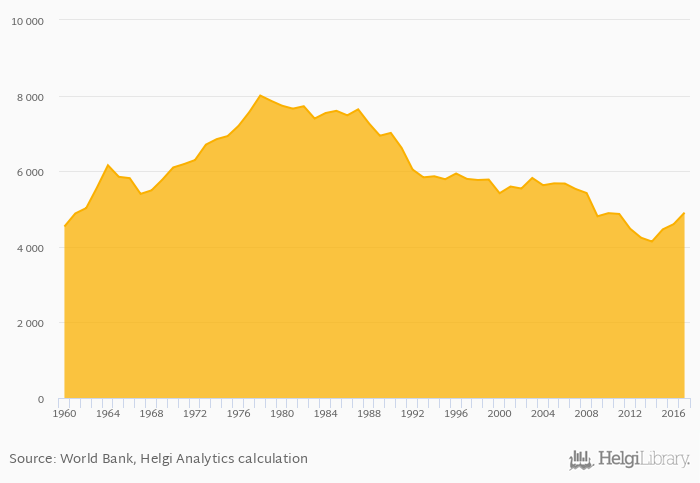
CO2 emissions per capita rose 6.61% to 4,903 kg in Hungary in 2017, according to World Bank / EIA.
Historically, CO2 emissions per capita in Hungary reached an all time high of 8,001 kg in 1978 and an all time low of 4,139 kg in 2014. When compared to Hungary's main peers, CO2 emissions per capita in Austria amounted to 7,547 kg, 9,715 kg in Czech Republic, 8,197 kg in Poland and 5,968 kg in Slovakia in 2017.
Hungary has been ranked 51st within the group of 79 countries we follow in terms of CO2 emissions per capita, 7 places above the position seen 10 years ago.
| CO2 Emissions Per Capita | Unit | 1997 | 1998 | 1999 | 2000 | 2001 | 2002 | 2003 | 2004 | 2005 | 2006 | 2007 | 2008 | 2009 | 2010 | 2011 | 2012 | 2013 | 2014 | 2015 | 2016 | 2017 |
| Austria | kg | 7,738 | 7,414 | 7,424 | 6,938 | 7,204 | ||||||||||||||||
| Czechia | kg | 10,493 | 10,036 | 9,842 | 9,301 | 9,633 | ||||||||||||||||
| Germany | kg | 9,189 | 9,328 | 9,647 | 9,117 | 9,195 | ||||||||||||||||
| Hungary | kg | 4,869 | 4,478 | 4,241 | 4,139 | 4,461 | ||||||||||||||||
| Italy | kg | 6,593 | 6,414 | 5,773 | 5,360 | 5,589 | ||||||||||||||||
| Poland | kg | 8,460 | 8,069 | 8,153 | 7,724 | 7,738 | ||||||||||||||||
| Russia | kg | 10,859 | 11,003 | 10,724 | 10,840 | 10,626 | ||||||||||||||||
| Slovakia | kg | 6,271 | 5,970 | 6,103 | 5,570 | 5,611 | ||||||||||||||||
| Switzerland | kg | 4,981 | 5,100 | 5,325 | 4,695 | 4,761 | ||||||||||||||||
| Ukraine | kg | 6,622 | 6,534 | 6,245 | 5,410 | 4,272 |
 Helgi Library


