
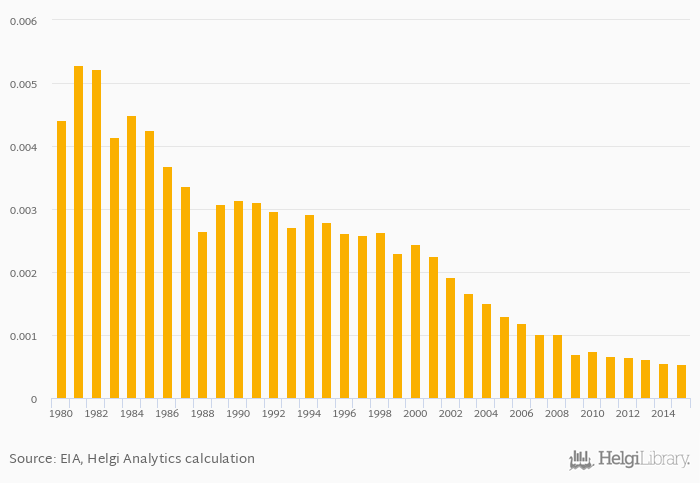
Coal consumption as a share of worldwide consumption fell 4.71% to < 0.001% in Belgium in 2015, according to the National Statistical Office.
Historically, coal consumption as a share of worldwide consumption in Belgium reached an all time high of 0.005% in 1981 and an all time low of < 0.001% in 2015. When compared to Belgium's main peers, coal consumption as a share of worldwide consumption in France amounted to 0.002%, 0.031% in Germany, < 0.001% in Luxembourg and 0.002% in Netherlands in 2015.
Belgium has been ranked 48th within the group of 126 countries we follow in terms of coal consumption as a share of worldwide consumption, 10 places below the position seen 10 years ago.
| Coal Consumption (As % of Worldwide Consumption) | Unit | 1995 | 1996 | 1997 | 1998 | 1999 | 2000 | 2001 | 2002 | 2003 | 2004 | 2005 | 2006 | 2007 | 2008 | 2009 | 2010 | 2011 | 2012 | 2013 | 2014 | 2015 |
| Austria | % | < 0.001% | < 0.001% | < 0.001% | < 0.001% | < 0.001% | ||||||||||||||||
| Belgium | % | < 0.001% | < 0.001% | < 0.001% | < 0.001% | < 0.001% | ||||||||||||||||
| Denmark | % | 0.001% | < 0.001% | < 0.001% | < 0.001% | < 0.001% | ||||||||||||||||
| France | % | 0.003% | 0.002% | 0.002% | 0.002% | 0.002% | ||||||||||||||||
| Germany | % | 0.033% | 0.031% | 0.030% | 0.031% | 0.030% | ||||||||||||||||
| Italy | % | 0.003% | 0.003% | 0.003% | 0.003% | 0.003% | ||||||||||||||||
| Luxembourg | % | < 0.001% | < 0.001% | < 0.001% | < 0.001% | < 0.001% | ||||||||||||||||
| Netherlands | % | 0.002% | 0.002% | 0.001% | 0.002% | 0.002% | ||||||||||||||||
| Poland | % | 0.019% | 0.019% | 0.018% | 0.018% | 0.018% | ||||||||||||||||
| Spain | % | 0.003% | 0.002% | 0.003% | 0.004% | 0.003% | ||||||||||||||||
| United Kingdom | % | 0.007% | 0.007% | 0.007% | 0.008% | 0.007% |
 Helgi Library


