
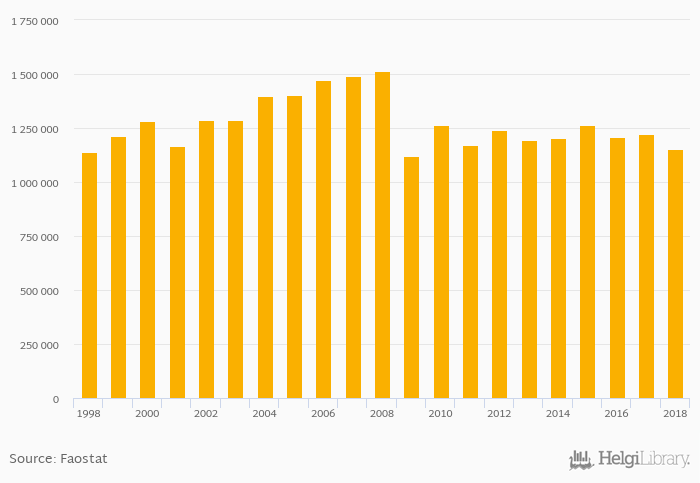
Coated papers production fell 6.03% to 1,150,649 kt in Austria in 2018, according to Faostat.
Historically, coated papers production in Austria reached an all time high of 1,512,256 kt in 2008 and an all time low of 1,122,119 kt in 2009.
Austria has been ranked 9th within the group of 40 countries we follow in terms of coated papers production, 1 place above the position seen 10 years ago.
| Coated Papers Production | Unit | 2000 | 2001 | 2002 | 2003 | 2004 | 2005 | 2006 | 2007 | 2008 | 2009 | 2010 | 2011 | 2012 | 2013 | 2014 | 2015 | 2016 | 2017 | 2018 | 2019 | 2020 |
| Austria | kt | 1,201,580 | 1,263,646 | 1,206,876 | 1,224,448 | 1,220,649 | ||||||||||||||||
| Belgium | kt | 1,141,000 | 1,185,000 | 1,159,222 | 1,118,000 | 1,053,000 | ||||||||||||||||
| Czechia | kt | 4,100 | 3,286 | 3,111 | 2,780 | 2,916 | ||||||||||||||||
| France | kt | 915,000 | 717,822 | 715,156 | 704,700 | 671,887 | ||||||||||||||||
| Germany | kt | 3,671,000 | 3,366,000 | 3,334,000 | 3,279,000 | 3,042,514 | ||||||||||||||||
| Hungary | kt | ... | ... | ... | ... | ... | ... | ... | ... | ... | ... | ... | ... | ... | ... | ... | ... | 4,828 | 5,000 | |||
| Italy | kt | 2,166,364 | 2,134,269 | 2,018,000 | 2,010,657 | 1,893,966 | ||||||||||||||||
| Poland | kt | ... | ... | 27,670 | 30,581 | 29,409 | 29,837 | 34,593 | ||||||||||||||
| Slovakia | kt | ... | ... | ... | ... | ... | ... | ... | ... | ... | ... | ... | ... | ... | ... | |||||||
| Slovenia | kt | 148,670 | 149,741 | 151,537 | 155,069 | 96,917 | ||||||||||||||||
| Switzerland | kt | 186,541 | 188,718 | 156,499 | 173,421 | 152,600 |
 Helgi Library


