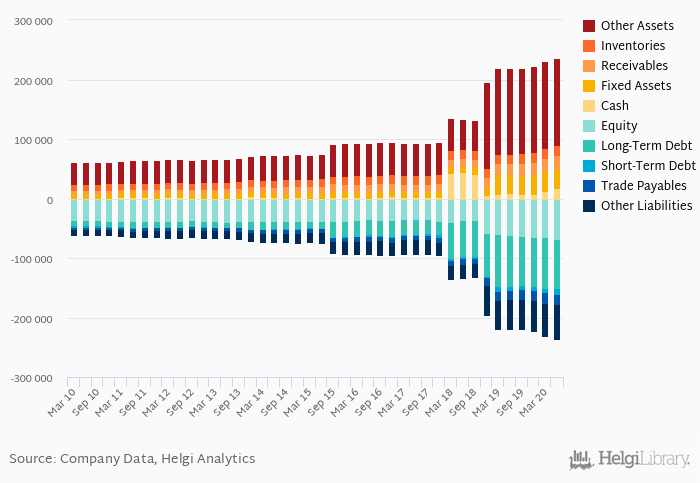
CVS Health's total assets reached USD 235,495 mil at the end of 2Q2020, up 7.58% compared to the previous year.
Current assets amounted to USD 62,506 mil, or 26.5% of total assets while cash stood at USD 17,465 mil at the end of 2Q2020.
By contrast, total debt reached USD 92,051 mil at the year-end, or 39.1% of total assets, while the firm's equity amounted to USD 68,355 mil. As a result, net debt stood at USD 74,586 mil at the end of 2Q2020 and accounted for 109% of equity.
Net debt against equity is up 77.5 pp from five years ago (31.6%). The ratio against EBITDA increased from 1.08x seen in 2Q2015 to 3.77x.
The company’s cost of funding amounted to 3.32% in 2Q2020, down 0.601 pp compared to the average over the last 5 years.
You can see all the company’s data at CVS Health profile, or you can download a report on the company in the report section.
Cash & Cash Equivalents | Unit | Mar 2008 | Jun 2008 | Sep 2008 | Dec 2008 | Mar 2009 | Jun 2009 | Sep 2009 | Dec 2009 | Mar 2010 | Jun 2010 | Sep 2010 | Dec 2010 | Mar 2011 | Jun 2011 | Sep 2011 | Dec 2011 | Mar 2012 | Jun 2012 | Sep 2012 | Dec 2012 | Mar 2013 | Jun 2013 | Sep 2013 | Dec 2013 | Mar 2014 | Jun 2014 | Sep 2014 | Dec 2014 | Mar 2015 | Jun 2015 | Sep 2015 | Dec 2015 | Mar 2016 | Jun 2016 | Sep 2016 | Dec 2016 | Mar 2017 | Jun 2017 | Sep 2017 | Dec 2017 | Mar 2018 | Jun 2018 | Sep 2018 | Dec 2018 | Mar 2019 | Jun 2019 | Sep 2019 | Dec 2019 | Mar 2020 | Jun 2020 |
CVS Health | USD mil | ... | ... | ... | ... | ... | ... | ... | ... | 6,581 | 8,322 | 8,525 | 7,527 | 8,056 | |||||||||||||||||||||||||||||||||||||
AVERAGE | USD mil | ... | ... | ... | ... | ... | ... | ... | ... | 1,051 | 1,111 | 983 | 1,431 | 2,168 | 2,233 | 1,712 | 1,418 | 2,216 | 1,828 | 1,238 | 1,380 | 1,556 | 1,179 | 1,613 | 4,177 | 2,848 | 1,712 | 1,210 | 2,515 | 1,634 | 1,404 | 3,011 | 2,547 | 1,864 | 1,207 | 2,263 | 3,458 | 2,302 | 2,169 | 2,560 | 1,807 | 42,142 | 43,911 | 41,692 | 6,581 | 8,322 | 8,525 | 7,527 | 8,056 | 12,713 | 17,465 |