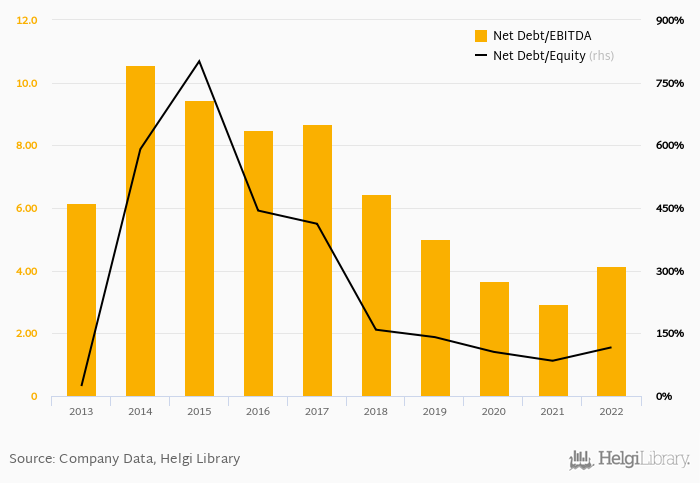
Dr.Max's net debt stood at CZK 7,055 mil and accounted for 117% of equity at the end of 2022. The ratio is up 32.2 pp compared to the previous year.
Historically, the firm’s net debt to equity reached a high of 801% in 2015 and a low of 23.8% in 2013 between 2013 and 2022. The average for the last five years was 121%.
Net debt to EBITDA was calculated at 4.15x at the end of the year. ERROR: A non-numeric value encountered That is up from 8.68x seen in 2017. The ratio reached a high of 10.5x in 2014 and a low of 2.94x in 2021.
The company’s cost of funding amounted to 4.53% in 2022, up which is above the 5-year of 4.32%. Funding costs have “eaten” some 23.9% of the operating profit generated in 2019.
You can see all the company’s data at Dr.Max profile, or you can download a report on the company in the report section.
 Helgi Library