
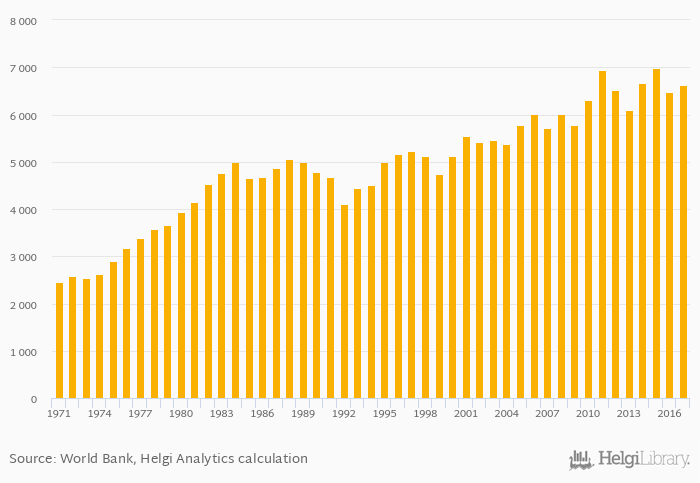
Electric power production per capita rose 2.15% to 6,621 kWh in Bulgaria in 2017, according to World Bank / EIA.
Historically, electric power production per capita in Bulgaria reached an all time high of 6,976 kWh in 2015 and an all time low of 2,459 kWh in 1971.
Bulgaria has been ranked 30th within the group of 79 countries we follow in terms of electric power production per capita, 7 places above the position seen 10 years ago.
| Electric Power Production Per Capita | Unit | 1997 | 1998 | 1999 | 2000 | 2001 | 2002 | 2003 | 2004 | 2005 | 2006 | 2007 | 2008 | 2009 | 2010 | 2011 | 2012 | 2013 | 2014 | 2015 | 2016 | 2017 |
| Albania | kWh | 1,320 | ... | ... | ... | ... | ... | ... | ||||||||||||||
| Bosnia and Herzegovina | kWh | 3,984 | ... | ... | ... | ... | ... | ... | ||||||||||||||
| Bulgaria | kWh | 6,933 | 6,518 | 6,086 | 6,663 | 6,976 | ||||||||||||||||
| Croatia | kWh | 2,633 | 2,503 | 3,289 | 3,192 | 2,701 | ||||||||||||||||
| Greece | kWh | 5,351 | 5,493 | 5,157 | 4,563 | 4,700 | ||||||||||||||||
| Hungary | kWh | 3,607 | 3,481 | 3,057 | 2,978 | 3,088 | ||||||||||||||||
| Iran | kWh | 3,128 | 3,266 | 3,362 | 3,544 | 3,568 | ||||||||||||||||
| Iraq | kWh | 1,328 | 1,461 | 1,848 | 2,060 | 2,125 | ||||||||||||||||
| Macedonia | kWh | 3,216 | 2,982 | 2,905 | 2,566 | 2,702 | ||||||||||||||||
| Moldova | kWh | 1,635 | ... | ... | ... | ... | ... | ... | ||||||||||||||
| Romania | kWh | 2,856 | 2,721 | 2,726 | 2,944 | 3,100 | ||||||||||||||||
| Serbia | kWh | 3,966 | ... | ... | ... | ... | ... | ... | ||||||||||||||
| Turkey | kWh | 3,144 | 3,246 | 3,221 | 3,347 | 3,448 | ||||||||||||||||
| Ukraine | kWh | 4,261 | 4,380 | 4,317 | 4,096 | 3,701 |
 Helgi Library


