
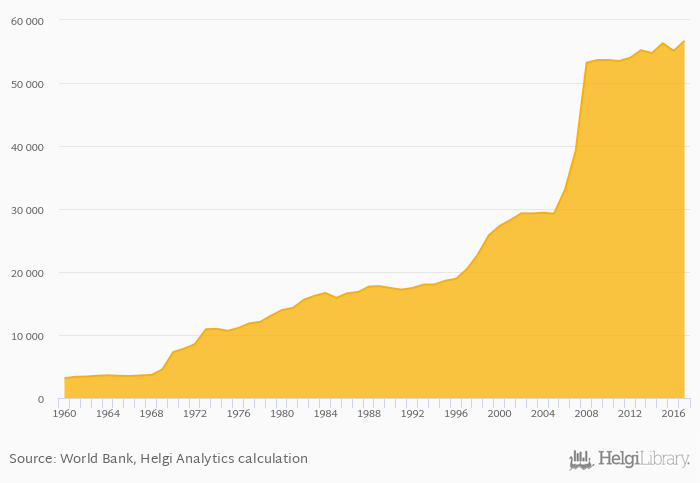
Electric power production per capita rose 2.90% to 56,696 kWh in Iceland in 2017, according to World Bank / EIA.
Historically, electric power production per capita in Iceland reached an all time high of 56,696 kWh in 2017 and an all time low of 3,139 kWh in 1960. When compared to Iceland's main peers, electric power production per capita in Denmark amounted to 5,473 kWh, 28,679 kWh in Norway, 16,886 kWh in Sweden and 5,268 kWh in United Kingdom in 2017.
Iceland has been ranked 1st within the group of 79 countries we follow in terms of electric power production per capita.
| Electric Power Production Per Capita | Unit | 1997 | 1998 | 1999 | 2000 | 2001 | 2002 | 2003 | 2004 | 2005 | 2006 | 2007 | 2008 | 2009 | 2010 | 2011 | 2012 | 2013 | 2014 | 2015 | 2016 | 2017 |
| Belgium | kWh | 8,206 | 7,514 | 7,548 | 6,559 | 6,295 | ||||||||||||||||
| Denmark | kWh | 6,324 | 5,496 | 6,206 | 5,737 | 5,151 | ||||||||||||||||
| Finland | kWh | 13,688 | 13,059 | 13,210 | 12,602 | 12,694 | ||||||||||||||||
| France | kWh | 8,894 | 8,848 | 8,960 | 8,777 | 8,844 | ||||||||||||||||
| Germany | kWh | 7,402 | 7,627 | 7,750 | 7,624 | 7,894 | ||||||||||||||||
| Iceland | kWh | 53,495 | 53,986 | 55,210 | 54,743 | 56,304 | ||||||||||||||||
| Ireland | kWh | 6,083 | 6,050 | 5,678 | 5,667 | 6,063 | ||||||||||||||||
| Netherlands | kWh | 6,784 | 6,146 | 6,042 | 6,189 | 6,585 | ||||||||||||||||
| Norway | kWh | 25,841 | 29,647 | 26,673 | 28,043 | 28,321 | ||||||||||||||||
| Russia | kWh | 7,363 | 7,489 | 7,451 | 7,523 | 7,586 | ||||||||||||||||
| Sweden | kWh | 16,012 | 17,523 | 16,063 | 16,045 | 16,846 | ||||||||||||||||
| United Kingdom | kWh | 5,900 | 5,809 | 5,697 | 5,357 | 5,351 |
 Helgi Library


