
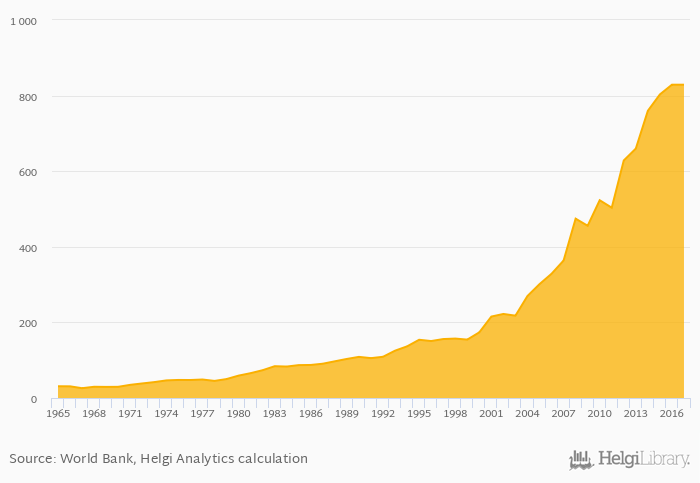
Electricity production from hydro sources per capita rose 0.004% to 829 kWh in China in 2017, according to World Bank / EIA.
Historically, electricity production from hydro sources per capita in China reached an all time high of 829 kWh in 2017 and an all time low of 25.9 kWh in 1967. When compared to China's main peers, electricity production from hydro sources per capita in India amounted to 105 kWh, 635 kWh in Japan, 1,316 kWh in Russia and 909 kWh in USA in 2017.
China has been ranked 21st within the group of 69 countries we follow in terms of electricity production from hydro sources per capita, 29 places above the position seen 10 years ago.
| Electricity Production from Hydro Sources Per Capita | Unit | 1997 | 1998 | 1999 | 2000 | 2001 | 2002 | 2003 | 2004 | 2005 | 2006 | 2007 | 2008 | 2009 | 2010 | 2011 | 2012 | 2013 | 2014 | 2015 | 2016 | 2017 |
| Bangladesh | kWh | 5.71 | 5.04 | 4.68 | 3.60 | 5.66 | ||||||||||||||||
| Canada | kWh | 10,905 | 10,941 | 11,182 | 10,833 | 10,743 | ||||||||||||||||
| China | kWh | 503 | 628 | 660 | 760 | 803 | ||||||||||||||||
| Germany | kWh | 213 | 267 | 279 | 238 | 232 | ||||||||||||||||
| India | kWh | 108 | 93.9 | 106 | 110 | 105 | ||||||||||||||||
| Japan | kWh | 635 | 599 | 616 | 633 | 666 | ||||||||||||||||
| Mexico | kWh | 304 | 265 | 230 | 317 | 249 | ||||||||||||||||
| Pakistan | kWh | 174 | 165 | 170 | 173 | 173 | ||||||||||||||||
| Russia | kWh | 1,138 | 1,145 | 1,274 | 1,226 | 1,194 | ||||||||||||||||
| South Korea | kWh | 94.4 | 82.1 | 87.5 | 55.9 | 43.5 | ||||||||||||||||
| Sri Lanka | kWh | 219 | 157 | 327 | 214 | 279 | ||||||||||||||||
| USA | kWh | 1,005 | 865 | 836 | 798 | 764 |
 Helgi Library


