
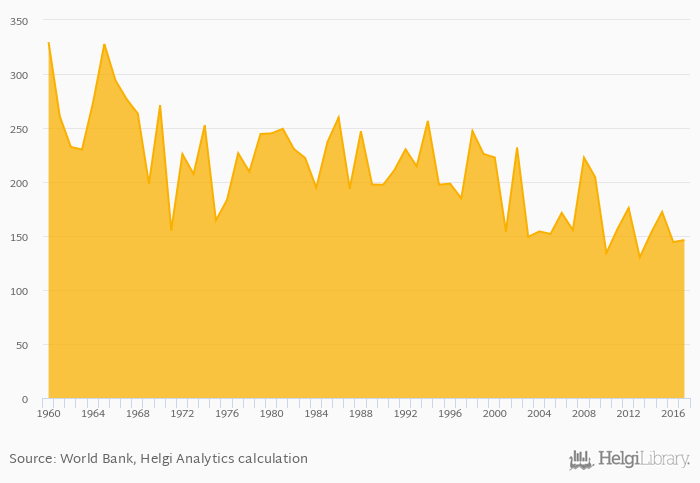
Electricity production from hydro sources per capita rose 1.32% to 146 kWh in Ireland in 2017, according to World Bank / EIA.
Historically, electricity production from hydro sources per capita in Ireland reached an all time high of 329 kWh in 1960 and an all time low of 130 kWh in 2013. When compared to Ireland's main peers, electricity production from hydro sources per capita in Canada amounted to 10,992 kWh, 759 kWh in France, 41,431 kWh in Iceland and 93.2 kWh in United Kingdom in 2017.
Ireland has been ranked 50th within the group of 69 countries we follow in terms of electricity production from hydro sources per capita, 24 places above the position seen 10 years ago.
| Electricity Production from Hydro Sources Per Capita | Unit | 1997 | 1998 | 1999 | 2000 | 2001 | 2002 | 2003 | 2004 | 2005 | 2006 | 2007 | 2008 | 2009 | 2010 | 2011 | 2012 | 2013 | 2014 | 2015 | 2016 | 2017 |
| Australia | kWh | 864 | 743 | 824 | 619 | 588 | ||||||||||||||||
| Belgium | kWh | 17.8 | 32.4 | 34.4 | 26.4 | 28.7 | ||||||||||||||||
| Canada | kWh | 10,905 | 10,941 | 11,182 | 10,833 | 10,743 | ||||||||||||||||
| Denmark | kWh | 3.03 | 3.12 | 2.40 | 2.69 | 3.21 | ||||||||||||||||
| France | kWh | 705 | 920 | 1,104 | 978 | 844 | ||||||||||||||||
| Germany | kWh | 213 | 267 | 279 | 238 | 232 | ||||||||||||||||
| Iceland | kWh | 38,875 | 37,951 | 39,200 | 38,886 | 41,275 | ||||||||||||||||
| Ireland | kWh | 156 | 176 | 130 | 153 | 172 | ||||||||||||||||
| Italy | kWh | 753 | 704 | 868 | 963 | 751 | ||||||||||||||||
| Mexico | kWh | 304 | 265 | 230 | 317 | 249 | ||||||||||||||||
| Norway | kWh | 24,355 | 28,447 | 25,514 | 26,754 | 26,908 | ||||||||||||||||
| Spain | kWh | 658 | 441 | 787 | 838 | 601 | ||||||||||||||||
| Sweden | kWh | 7,104 | 8,318 | 6,435 | 6,658 | 7,829 | ||||||||||||||||
| USA | kWh | 1,005 | 865 | 836 | 798 | 764 | ||||||||||||||||
| United Kingdom | kWh | 91.3 | 84.8 | 74.8 | 93.3 | 99.4 |
 Helgi Library


