
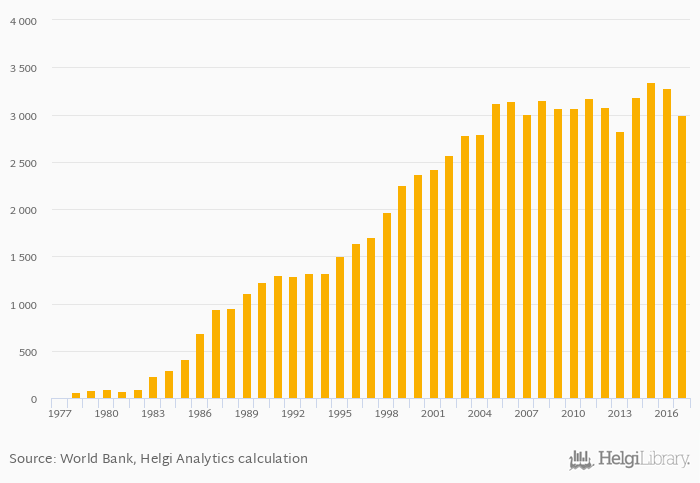
Electricity production from nuclear sources per capita fell 8.53% to 2,999 kWh in South Korea in 2017, according to World Bank / EIA.
Historically, electricity production from nuclear sources per capita in South Korea reached an all time high of 3,342 kWh in 2015 and an all time low of 1.99 kWh in 1977.
South Korea has been ranked 6th within the group of 31 countries we follow in terms of electricity production from nuclear sources per capita, 1 place above the position seen 10 years ago.
| Electricity Production from Nuclear Sources Per Capita | Unit | 1997 | 1998 | 1999 | 2000 | 2001 | 2002 | 2003 | 2004 | 2005 | 2006 | 2007 | 2008 | 2009 | 2010 | 2011 | 2012 | 2013 | 2014 | 2015 | 2016 | 2017 |
| Cambodia | kWh | ... | ... | ... | ... | ... | ... | ... | ... | ... | ... | ... | ... | ... | ... | ... | ... | ... | ... | ... | ... | ... |
| China | kWh | 63.2 | 70.9 | 81.0 | 95.8 | 123 | ||||||||||||||||
| Dem. People's Republic of Korea | kWh | ... | ... | ... | ... | ... | ... | ... | ... | ... | ... | ... | ... | ... | ... | ... | ... | ... | ... | ... | ... | ... |
| India | kWh | 26.4 | 26.9 | 26.7 | 27.6 | 30.2 | ||||||||||||||||
| Japan | kWh | 1,281 | 142 | 115 | ... | 35.9 | ||||||||||||||||
| Laos | kWh | ... | ... | ... | ... | ... | ... | ... | ... | ... | ... | ... | ... | ... | ... | ... | ... | ... | ... | ... | ... | ... |
| Russia | kWh | 1,207 | 1,243 | 1,214 | 1,278 | 1,389 | ||||||||||||||||
| South Korea | kWh | 3,178 | 3,076 | 2,830 | 3,180 | 3,342 | ||||||||||||||||
| Thailand | kWh | 633 | 607 | ... | ... | ... | ... | ... | ||||||||||||||
| USA | kWh | 2,644 | 2,557 | 2,606 | 2,617 | 2,602 | ||||||||||||||||
| Vietnam | kWh | ... | ... | ... | ... | ... | ... | ... | ... | ... | ... | ... | ... | ... | ... | ... | ... | ... | ... | ... | ... | ... |
 Helgi Library


