
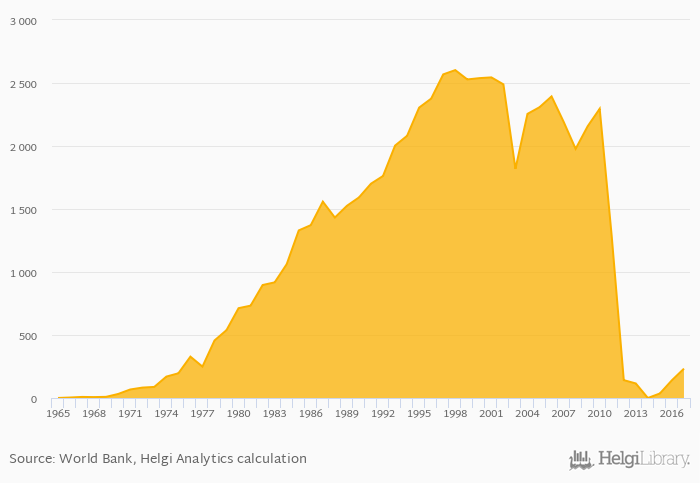
Electricity production from nuclear sources per capita rose 65.1% to 233 kWh in Japan in 2017, according to World Bank / EIA.
Historically, electricity production from nuclear sources per capita in Japan reached an all time high of 2,602 kWh in 1998 and an all time low of 0 kWh in 2014. When compared to Japan's main peers, electricity production from nuclear sources per capita in China amounted to 178 kWh, 1,459 kWh in Russia, 2,999 kWh in South Korea and 2,599 kWh in USA in 2017.
Japan has been ranked 22nd within the group of 31 countries we follow in terms of electricity production from nuclear sources per capita, 9 places below the position seen 10 years ago.
| Electricity Production from Nuclear Sources Per Capita | Unit | 1997 | 1998 | 1999 | 2000 | 2001 | 2002 | 2003 | 2004 | 2005 | 2006 | 2007 | 2008 | 2009 | 2010 | 2011 | 2012 | 2013 | 2014 | 2015 | 2016 | 2017 |
| Canada | kWh | 2,698 | 2,710 | 2,932 | 3,017 | 2,842 | ||||||||||||||||
| China | kWh | 63.2 | 70.9 | 81.0 | 95.8 | 123 | ||||||||||||||||
| Dem. People's Republic of Korea | kWh | ... | ... | ... | ... | ... | ... | ... | ... | ... | ... | ... | ... | ... | ... | ... | ... | ... | ... | ... | ... | ... |
| Germany | kWh | 1,304 | 1,204 | 1,180 | 1,182 | 1,120 | ||||||||||||||||
| India | kWh | 26.4 | 26.9 | 26.7 | 27.6 | 30.2 | ||||||||||||||||
| Japan | kWh | 1,281 | 142 | 115 | ... | 35.9 | ||||||||||||||||
| Mexico | kWh | 84.6 | 72.8 | 97.0 | 78.8 | 93.4 | ||||||||||||||||
| Russia | kWh | 1,207 | 1,243 | 1,214 | 1,278 | 1,389 | ||||||||||||||||
| South Korea | kWh | 3,178 | 3,076 | 2,830 | 3,180 | 3,342 | ||||||||||||||||
| USA | kWh | 2,644 | 2,557 | 2,606 | 2,617 | 2,602 | ||||||||||||||||
| Vietnam | kWh | ... | ... | ... | ... | ... | ... | ... | ... | ... | ... | ... | ... | ... | ... | ... | ... | ... | ... | ... | ... | ... |
 Helgi Library


