
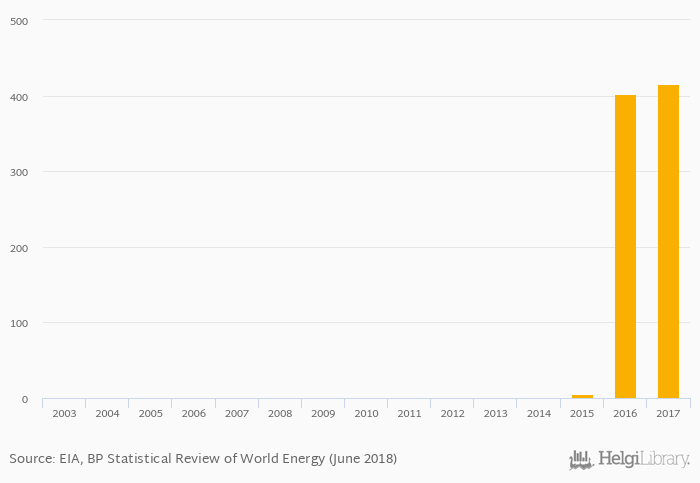
Electricity production from solar photovoltaic rose 3.44% to 415 GWh in Morocco in 2017, according to World Bank / EIA.
Historically, electricity production from solar photovoltaic in Morocco reached an all time high of 415 GWh in 2017 and an all time low of 0.100 GWh in 2003.
Morocco has been ranked 38th within the group of 78 countries we follow in terms of electricity production from solar photovoltaic, 6 places above the position seen 10 years ago.
| Electricity Production from Solar Photovoltaic | Unit | 1999 | 2000 | 2001 | 2002 | 2003 | 2004 | 2005 | 2006 | 2007 | 2008 | 2009 | 2010 | 2011 | 2012 | 2013 | 2014 | 2015 | 2016 | 2017 | 2018 | 2019 |
| Algeria | GWh | ... | ... | ... | ... | ... | ... | ... | ... | ... | ... | ... | 0.100 | 0.100 | 58.0 | 87.0 | 572 | |||||
| France | GWh | 5,194 | 6,391 | 7,753 | 8,659 | 9,585 | ||||||||||||||||
| Italy | GWh | 21,229 | 21,837 | 22,588 | 21,757 | 24,017 | ||||||||||||||||
| Libya | GWh | ... | ... | ... | ... | ... | ... | ... | ... | ... | ... | ... | 8.00 | 8.00 | 8.00 | 8.00 | 8.00 | |||||
| Mali | GWh | ... | ... | ... | ... | ... | ... | ... | ... | ... | ... | ... | 26.0 | 26.0 | 28.0 | 28.0 | 32.0 | |||||
| Malta | GWh | ... | ... | ... | ... | ... | ... | ... | ... | ... | ... | 30.0 | 70.0 | 95.0 | 128 | 162 | ||||||
| Mauritania | GWh | ... | ... | ... | ... | ... | ... | ... | ... | ... | ... | ... | ... | ... | ... | 26.0 | 30.0 | 26.0 | 57.0 | 57.0 | ||
| Morocco | GWh | ... | ... | ... | 0.101 | 0.101 | 5.00 | 401 | 415 | |||||||||||||
| Portugal | GWh | 479 | 627 | 796 | 871 | 992 | ||||||||||||||||
| Senegal | GWh | ... | 4.00 | 4.00 | 4.00 | 6.00 | 99.0 | |||||||||||||||
| Spain | GWh | 12,662 | 13,177 | 13,351 | 13,051 | 13,778 | ||||||||||||||||
| Tunisia | GWh | ... | ... | ... | ... | ... | ... | ... | ... | ... | ... | ... | 14.0 | 34.0 | 65.0 | 109 | 133 |
 Helgi Library


