
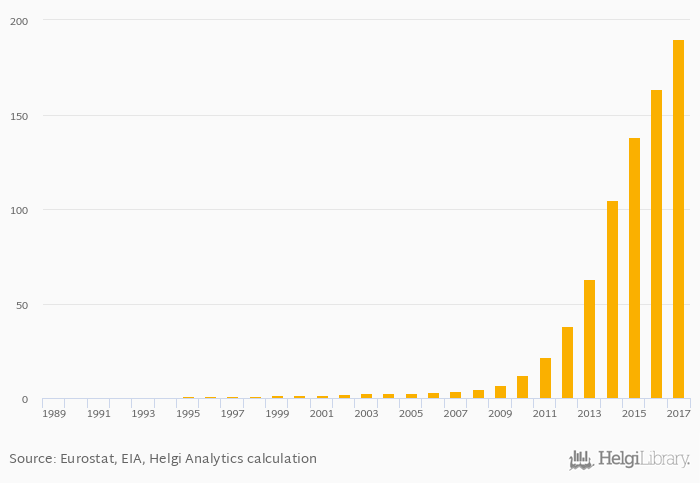
Electricity production from solar photovoltaic sources per capita rose 16.2% to 190 kWh in Switzerland in 2017, according to World Bank / EIA.
Historically, electricity production from solar photovoltaic sources per capita in Switzerland reached an all time high of 190 kWh in 2017 and an all time low of 0 kWh in 1989. When compared to Switzerland's main peers, electricity production from solar photovoltaic sources per capita in Austria amounted to 157 kWh, 141 kWh in France, 490 kWh in Germany and 416 kWh in Italy in 2017.
Switzerland has been ranked 13th within the group of 78 countries we follow in terms of electricity production from solar photovoltaic sources per capita, 7 places below the position seen 10 years ago.
| Electricity Production from Solar Photovoltaic Sources Per Capita | Unit | 1997 | 1998 | 1999 | 2000 | 2001 | 2002 | 2003 | 2004 | 2005 | 2006 | 2007 | 2008 | 2009 | 2010 | 2011 | 2012 | 2013 | 2014 | 2015 | 2016 | 2017 |
| Austria | kWh | 20.7 | 40.0 | 74.0 | 92.6 | 110 | ||||||||||||||||
| Belgium | kWh | ... | ... | ... | ... | ... | ... | ... | 106 | 195 | 239 | 260 | 275 | |||||||||
| France | kWh | 32.7 | 63.0 | 73.9 | 92.0 | 113 | ||||||||||||||||
| Germany | kWh | 237 | 319 | 376 | 439 | 473 | ||||||||||||||||
| Hungary | kWh | ... | ... | ... | ... | ... | ... | ... | ... | ... | ... | ... | 0.100 | 0.804 | 2.52 | 5.67 | 12.5 | |||||
| Italy | kWh | 178 | 317 | 355 | 367 | 378 | ||||||||||||||||
| Poland | kWh | ... | ... | ... | ... | ... | ... | ... | ... | ... | ... | ... | ... | ... | ... | 0.005 | 0.029 | 0.039 | 0.184 | 1.51 | ||
| Slovenia | kWh | ... | ... | ... | ... | ... | ... | ... | ... | 32.0 | 79.0 | 104 | 125 | 133 | ||||||||
| Spain | kWh | 187 | 257 | 281 | 292 | 296 | ||||||||||||||||
| Switzerland | kWh | 21.5 | 37.9 | 62.8 | 105 | 138 |
 Helgi Library


