
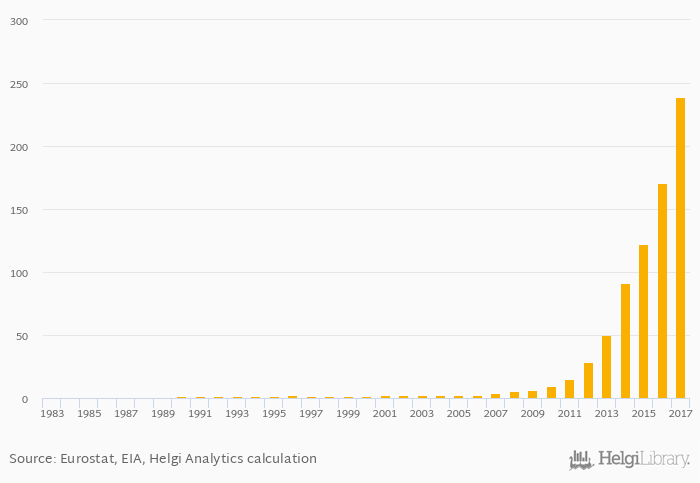
Electricity production from solar photovoltaic sources per capita rose 39.8% to 239 kWh in the USA in 2017, according to World Bank / EIA.
Historically, electricity production from solar photovoltaic sources per capita in the USA reached an all time high of 239 kWh in 2017 and an all time low of 0.013 kWh in 1983. When compared to USA's main peers, electricity production from solar photovoltaic sources per capita in Canada amounted to 89.9 kWh, 77.6 kWh in China, 499 kWh in Japan and 4.84 kWh in Mexico in 2017.
USA has been ranked 8th within the group of 78 countries we follow in terms of electricity production from solar photovoltaic sources per capita, 1 place below the position seen 10 years ago.
| Electricity Production from Solar Photovoltaic Sources Per Capita | Unit | 1997 | 1998 | 1999 | 2000 | 2001 | 2002 | 2003 | 2004 | 2005 | 2006 | 2007 | 2008 | 2009 | 2010 | 2011 | 2012 | 2013 | 2014 | 2015 | 2016 | 2017 |
| Australia | kWh | 90.0 | 105 | 166 | 211 | 251 | ||||||||||||||||
| Belize | kWh | ... | 0.633 | ... | ... | ... | ... | ... | ... | |||||||||||||
| Canada | kWh | 16.6 | 25.3 | 42.8 | 60.0 | 81.4 | ||||||||||||||||
| China | kWh | 1.91 | 2.62 | 6.07 | 17.0 | 31.4 | ||||||||||||||||
| Guatemala | kWh | ... | ... | ... | ... | ... | ... | ... | ... | ... | ... | ... | ... | ... | ... | ... | ... | ... | ... | ... | ... | ... |
| Honduras | kWh | ... | ... | ... | ... | ... | ... | ... | ... | ... | ... | ... | ... | ... | ... | ... | ... | ... | ... | ... | ... | ... |
| India | kWh | 0.678 | 1.70 | 2.75 | 3.90 | 5.17 | ||||||||||||||||
| Japan | kWh | 42.8 | 58.1 | 102 | 186 | 274 | ||||||||||||||||
| Mexico | kWh | 0.344 | 0.573 | 0.871 | 1.80 | 1.98 | ||||||||||||||||
| Russia | kWh | ... | ... | ... | ... | ... | ... | ... | ... | ... | ... | 0.008 | 0.029 | 0.076 | 1.13 | 2.38 | ||||||
| South Korea | kWh | 18.8 | 22.6 | 32.7 | 52.0 | 80.7 | ||||||||||||||||
| USA | kWh | 15.1 | 28.5 | 50.3 | 91.1 | 122 | ||||||||||||||||
| United Kingdom | kWh | 3.91 | 21.6 | 32.0 | 64.2 | 119 |
 Helgi Library


