
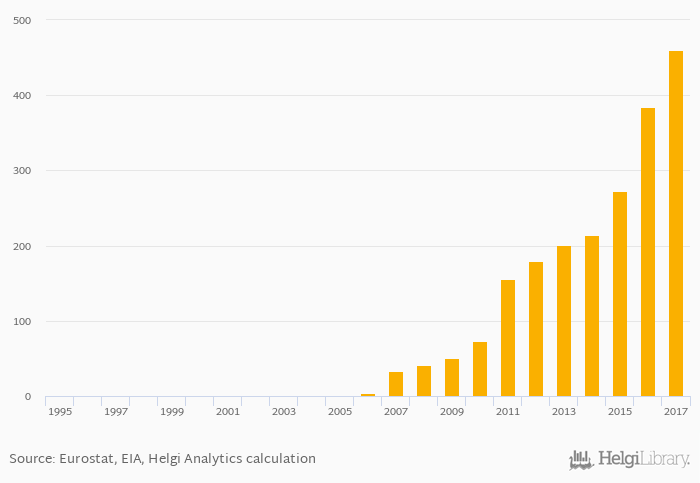
Electricity production from wind power sources per capita rose 19.7% to 460 kWh in Lithuania in 2017, according to World Bank / EIA.
Historically, electricity production from wind power sources per capita in Lithuania reached an all time high of 460 kWh in 2017 and an all time low of 0 kWh in 1995. When compared to Lithuania's main peers, electricity production from wind power sources per capita in Belarus amounted to 11.3 kWh, 569 kWh in Estonia, 77.2 kWh in Latvia and 0.998 kWh in Russia in 2017.
Lithuania has been ranked 19th within the group of 71 countries we follow in terms of electricity production from wind power sources per capita, 3 places above the position seen 10 years ago.
| Electricity Production from Wind Power Sources Per Capita | Unit | 1997 | 1998 | 1999 | 2000 | 2001 | 2002 | 2003 | 2004 | 2005 | 2006 | 2007 | 2008 | 2009 | 2010 | 2011 | 2012 | 2013 | 2014 | 2015 | 2016 | 2017 |
| Belarus | kWh | ... | ... | ... | 0.424 | 0.640 | 0.859 | 0.974 | 4.25 | |||||||||||||
| China | kWh | 51.5 | 69.9 | 102 | 113 | 134 | ||||||||||||||||
| Estonia | kWh | ... | ... | ... | ... | 285 | 337 | 413 | 473 | 563 | ||||||||||||
| Finland | kWh | 89.4 | 91.6 | 143 | 205 | 429 | ||||||||||||||||
| Germany | kWh | 602 | 625 | 640 | 712 | 984 | ||||||||||||||||
| Japan | kWh | 35.1 | 37.2 | 40.5 | 39.7 | 41.5 | ||||||||||||||||
| Latvia | kWh | 34.3 | 52.5 | 58.3 | 49.8 | 73.0 | ||||||||||||||||
| Lithuania | kWh | 156 | 179 | 201 | 214 | 273 | ||||||||||||||||
| Poland | kWh | 84.0 | 125 | 158 | 202 | 287 | ||||||||||||||||
| Russia | kWh | 0.038 | 0.037 | 0.031 | 0.679 | 1.03 | ||||||||||||||||
| USA | kWh | 386 | 449 | 532 | 572 | 597 | ||||||||||||||||
| Ukraine | kWh | 1.95 | 6.34 | 14.2 | 25.3 | 24.5 |
 Helgi Library


