
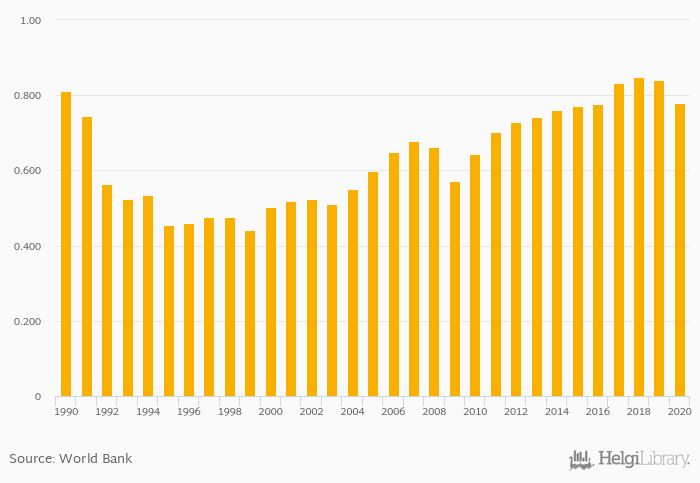
Exports as a share of GDP fell 7.24% to 0.779% in Slovenia in 2020, according to the National Statistical Office.
Historically, exports as a share of GDP in Slovenia reached an all time high of 0.848% in 2018 and an all time low of 0.441% in 1999. When compared to Slovenia's main peers, exports as a share of GDP in Austria amounted to 0.514%, 0.420% in Croatia, 0.795% in Hungary and 0.294% in Italy in 2020.
Slovenia has been ranked 11th within the group of 155 countries we follow in terms of exports as a share of GDP, 18 places above the position seen 10 years ago.
| Exports (As % of GDP) | Unit | 2001 | 2002 | 2003 | 2004 | 2005 | 2006 | 2007 | 2008 | 2009 | 2010 | 2011 | 2012 | 2013 | 2014 | 2015 | 2016 | 2017 | 2018 | 2019 | 2020 | 2021 |
| Austria | % | 0.531% | 0.524% | 0.541% | 0.555% | 0.558% | ||||||||||||||||
| Bosnia and Herzegovina | % | 0.355% | 0.363% | 0.409% | 0.426% | 0.406% | ||||||||||||||||
| Croatia | % | 0.457% | 0.469% | 0.491% | 0.494% | 0.506% | ||||||||||||||||
| Czechia | % | 0.806% | 0.791% | 0.790% | 0.769% | 0.739% | ||||||||||||||||
| France | % | 0.306% | 0.302% | 0.309% | 0.317% | 0.316% | ||||||||||||||||
| Germany | % | 0.469% | 0.461% | 0.472% | 0.473% | 0.467% | ||||||||||||||||
| Hungary | % | 0.875% | 0.864% | 0.859% | 0.838% | 0.815% | ||||||||||||||||
| Italy | % | 0.297% | 0.293% | 0.307% | 0.314% | 0.316% | ||||||||||||||||
| Montenegro | % | 0.421% | 0.406% | 0.411% | 0.429% | 0.438% | ||||||||||||||||
| Poland | % | 0.475% | 0.503% | 0.521% | 0.527% | 0.532% | ||||||||||||||||
| Serbia | % | 0.452% | 0.485% | 0.505% | 0.504% | 0.510% | ||||||||||||||||
| Slovakia | % | 0.916% | 0.935% | 0.951% | 0.958% | 0.919% | ||||||||||||||||
| Slovenia | % | 0.771% | 0.776% | 0.831% | 0.848% | 0.837% | ||||||||||||||||
| Switzerland | % | 0.638% | 0.668% | 0.663% | 0.675% | 0.670% |
 Helgi Library


